class: center, middle, inverse, title-slide .title[ # Making a ‘Big Number’ (And Circle) ] .subtitle[ ## With R ] .author[ ### Andy Grogan-Kaylor ] --- <style type="text/css"> @import url('https://fonts.googleapis.com/css2?family=Montserrat&display=swap'); h1, h2, h3 { font-family: 'Montserrat', sans-serif; } body { font-family: 'Montserrat', sans-serif; } .author, .date { font-family: 'Montserrat', sans-serif; } .title-slide { color: #ffcb05; background-color: #00274C; } .title-slide h1 { color: #ffcb05; } pre { white-space: pre-wrap; } blockquote { background: #FFFFFF; color: #000; border-left: 5px solid #ffcb05; margin: 1.5em 10px; padding: 0.5em 10px; } </style> # How To Navigate This Presentation * Use the ⬅️ ➡️ keys to move through the presentation. * Press *o* for *panel overview*. -- # Background A big number, enclosed by a circular bar graph, can be a compelling data visualization. This presentation provides code for creating such data visualizations. The use of code initially makes this work more difficult than if using a drag-and-drop interface, but ultimately automates the work and makes it auditable and replicable. --- # Example Using 30% and Michigan Blue --- count: false .panel1-graph1-auto[ ```r *library(ggplot2) # beautiful graphs ``` ] .panel2-graph1-auto[ ] --- count: false .panel1-graph1-auto[ ```r library(ggplot2) # beautiful graphs *ggplot(data = NULL, # NULL data set * aes(x = 3, # arbitrary x; 3 is good * y = 30)) # y value to be graphed ``` ] .panel2-graph1-auto[ <!-- --> ] --- count: false .panel1-graph1-auto[ ```r library(ggplot2) # beautiful graphs ggplot(data = NULL, # NULL data set aes(x = 3, # arbitrary x; 3 is good y = 30)) + # y value to be graphed * geom_col(fill = "#00274C") # column & column color ``` ] .panel2-graph1-auto[ <!-- --> ] --- count: false .panel1-graph1-auto[ ```r library(ggplot2) # beautiful graphs ggplot(data = NULL, # NULL data set aes(x = 3, # arbitrary x; 3 is good y = 30)) + # y value to be graphed geom_col(fill = "#00274C") + # column & column color * coord_polar(theta = "y") # polar coordinates ``` ] .panel2-graph1-auto[ <!-- --> ] --- count: false .panel1-graph1-auto[ ```r library(ggplot2) # beautiful graphs ggplot(data = NULL, # NULL data set aes(x = 3, # arbitrary x; 3 is good y = 30)) + # y value to be graphed geom_col(fill = "#00274C") + # column & column color coord_polar(theta = "y") + # polar coordinates * xlim(0, 4) # xlimits create a doughnut ``` ] .panel2-graph1-auto[ <!-- --> ] --- count: false .panel1-graph1-auto[ ```r library(ggplot2) # beautiful graphs ggplot(data = NULL, # NULL data set aes(x = 3, # arbitrary x; 3 is good y = 30)) + # y value to be graphed geom_col(fill = "#00274C") + # column & column color coord_polar(theta = "y") + # polar coordinates xlim(0, 4) + # xlimits create a doughnut * ylim(0, 100) # ylimits govern the circumference ``` ] .panel2-graph1-auto[ 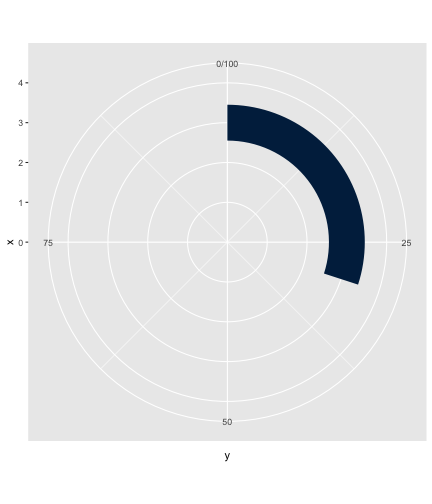<!-- --> ] --- count: false .panel1-graph1-auto[ ```r library(ggplot2) # beautiful graphs ggplot(data = NULL, # NULL data set aes(x = 3, # arbitrary x; 3 is good y = 30)) + # y value to be graphed geom_col(fill = "#00274C") + # column & column color coord_polar(theta = "y") + # polar coordinates xlim(0, 4) + # xlimits create a doughnut ylim(0, 100) + # ylimits govern the circumference * geom_text(aes(x = 0, # text in center * y = 0, * label = "30%"), # label for text * size = 30, # text size * col = "#00274C") # text color ``` ] .panel2-graph1-auto[ 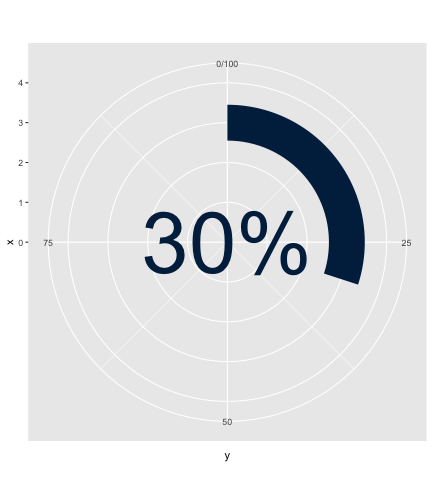<!-- --> ] --- count: false .panel1-graph1-auto[ ```r library(ggplot2) # beautiful graphs ggplot(data = NULL, # NULL data set aes(x = 3, # arbitrary x; 3 is good y = 30)) + # y value to be graphed geom_col(fill = "#00274C") + # column & column color coord_polar(theta = "y") + # polar coordinates xlim(0, 4) + # xlimits create a doughnut ylim(0, 100) + # ylimits govern the circumference geom_text(aes(x = 0, # text in center y = 0, label = "30%"), # label for text size = 30, # text size col = "#00274C") + # text color * theme_void() # empty theme ``` ] .panel2-graph1-auto[ 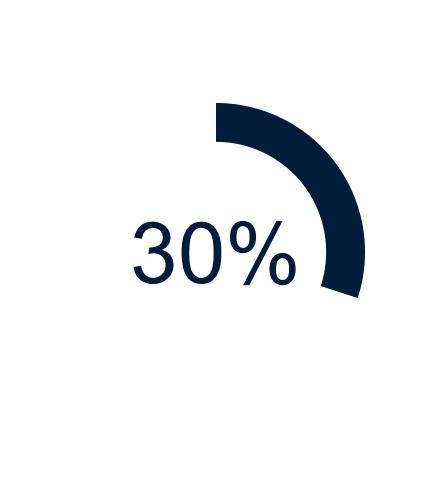<!-- --> ] --- count: false .panel1-graph1-auto[ ```r library(ggplot2) # beautiful graphs ggplot(data = NULL, # NULL data set aes(x = 3, # arbitrary x; 3 is good y = 30)) + # y value to be graphed geom_col(fill = "#00274C") + # column & column color coord_polar(theta = "y") + # polar coordinates xlim(0, 4) + # xlimits create a doughnut ylim(0, 100) + # ylimits govern the circumference geom_text(aes(x = 0, # text in center y = 0, label = "30%"), # label for text size = 30, # text size col = "#00274C") + # text color theme_void() # empty theme ``` ] .panel2-graph1-auto[ 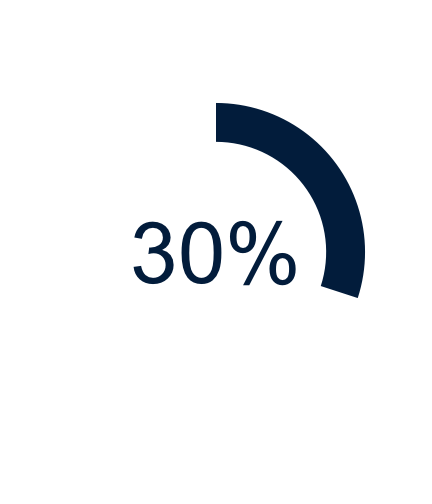<!-- --> ] <style> .panel1-graph1-auto { color: black; width: 65.3333333333333%; hight: 32%; float: left; padding-left: 1%; font-size: 80% } .panel2-graph1-auto { color: black; width: 32.6666666666667%; hight: 32%; float: left; padding-left: 1%; font-size: 80% } .panel3-graph1-auto { color: black; width: NA%; hight: 33%; float: left; padding-left: 1%; font-size: 80% } </style> --- # Example Using 81% And Michigan Maize --- count: false .panel1-graph2-auto[ ```r *library(ggplot2) # beautiful graphs ``` ] .panel2-graph2-auto[ ] --- count: false .panel1-graph2-auto[ ```r library(ggplot2) # beautiful graphs *ggplot(data = NULL, # NULL data set * aes(x = 3, # arbitrary x; 3 is good * y = 81)) # y value to be graphed ``` ] .panel2-graph2-auto[ <!-- --> ] --- count: false .panel1-graph2-auto[ ```r library(ggplot2) # beautiful graphs ggplot(data = NULL, # NULL data set aes(x = 3, # arbitrary x; 3 is good y = 81)) + # y value to be graphed * geom_col(fill = "#ffcb05") # column & column color ``` ] .panel2-graph2-auto[ <!-- --> ] --- count: false .panel1-graph2-auto[ ```r library(ggplot2) # beautiful graphs ggplot(data = NULL, # NULL data set aes(x = 3, # arbitrary x; 3 is good y = 81)) + # y value to be graphed geom_col(fill = "#ffcb05") + # column & column color * coord_polar(theta = "y") # polar coordinates ``` ] .panel2-graph2-auto[ <!-- --> ] --- count: false .panel1-graph2-auto[ ```r library(ggplot2) # beautiful graphs ggplot(data = NULL, # NULL data set aes(x = 3, # arbitrary x; 3 is good y = 81)) + # y value to be graphed geom_col(fill = "#ffcb05") + # column & column color coord_polar(theta = "y") + # polar coordinates * xlim(0, 4) # xlimits create a doughnut ``` ] .panel2-graph2-auto[ <!-- --> ] --- count: false .panel1-graph2-auto[ ```r library(ggplot2) # beautiful graphs ggplot(data = NULL, # NULL data set aes(x = 3, # arbitrary x; 3 is good y = 81)) + # y value to be graphed geom_col(fill = "#ffcb05") + # column & column color coord_polar(theta = "y") + # polar coordinates xlim(0, 4) + # xlimits create a doughnut * ylim(0, 100) # ylimits govern the circumference ``` ] .panel2-graph2-auto[ <!-- --> ] --- count: false .panel1-graph2-auto[ ```r library(ggplot2) # beautiful graphs ggplot(data = NULL, # NULL data set aes(x = 3, # arbitrary x; 3 is good y = 81)) + # y value to be graphed geom_col(fill = "#ffcb05") + # column & column color coord_polar(theta = "y") + # polar coordinates xlim(0, 4) + # xlimits create a doughnut ylim(0, 100) + # ylimits govern the circumference * geom_text(aes(x = 0, # text in center * y = 0, * label = "81%"), # label for text * size = 30, # text size * col = "#ffcb05") # text color ``` ] .panel2-graph2-auto[ <!-- --> ] --- count: false .panel1-graph2-auto[ ```r library(ggplot2) # beautiful graphs ggplot(data = NULL, # NULL data set aes(x = 3, # arbitrary x; 3 is good y = 81)) + # y value to be graphed geom_col(fill = "#ffcb05") + # column & column color coord_polar(theta = "y") + # polar coordinates xlim(0, 4) + # xlimits create a doughnut ylim(0, 100) + # ylimits govern the circumference geom_text(aes(x = 0, # text in center y = 0, label = "81%"), # label for text size = 30, # text size col = "#ffcb05") + # text color * theme_void() # empty theme ``` ] .panel2-graph2-auto[ <!-- --> ] --- count: false .panel1-graph2-auto[ ```r library(ggplot2) # beautiful graphs ggplot(data = NULL, # NULL data set aes(x = 3, # arbitrary x; 3 is good y = 81)) + # y value to be graphed geom_col(fill = "#ffcb05") + # column & column color coord_polar(theta = "y") + # polar coordinates xlim(0, 4) + # xlimits create a doughnut ylim(0, 100) + # ylimits govern the circumference geom_text(aes(x = 0, # text in center y = 0, label = "81%"), # label for text size = 30, # text size col = "#ffcb05") + # text color theme_void() # empty theme ``` ] .panel2-graph2-auto[ <!-- --> ] <style> .panel1-graph2-auto { color: black; width: 65.3333333333333%; hight: 32%; float: left; padding-left: 1%; font-size: 80% } .panel2-graph2-auto { color: black; width: 32.6666666666667%; hight: 32%; float: left; padding-left: 1%; font-size: 80% } .panel3-graph2-auto { color: black; width: NA%; hight: 33%; float: left; padding-left: 1%; font-size: 80% } </style>