Introduction
Stata provides the use of graph schemes that improve the overall look of graphs.
See help scheme.
The Michigan graph scheme makes use of official University of Michigan colors.
Installation
Type net from https://agrogan1.github.io/Stata and click the links to install.
Example Data
We are going to use the famous “iris” data collected by Edgar Anderson.
clear all use "iris.dta" , clear
                Summary
--------------------------
N                      150
Sepal.Length 5.843 (0.828)
Sepal.Width  3.057 (0.436)
Petal.Length 3.758 (1.765)
Petal.Width  1.199 (0.762)
Species
  setosa        50 (33.3%)
  versicolor    50 (33.3%)
  virginica     50 (33.3%)
--------------------------
Histogram
histogram Petal_Length, scheme (michigan)
Histogram With Transparency
histogram Petal_Length, fcolor(%50) scheme (michigan)
Bar Graph
graph bar Petal_Length, over (Species) scheme (michigan) asyvars
Bar Graph With Transparency
graph bar Petal_Length, over (Species) intensity(70) scheme (michigan) asyvars
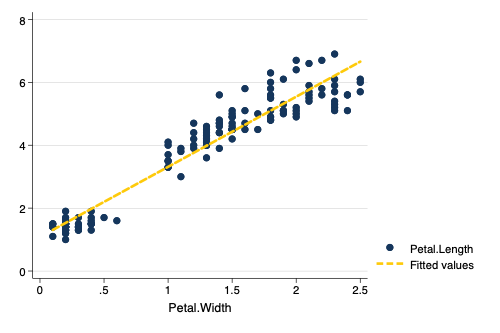
Scatterplot
twoway (scatter Petal_Length Petal_Width) /// lfit Petal_Length Petal_Width), /// scheme (michigan)
Scatterplot With Transparency
twoway (scatter Petal_Length Petal_Width, mcolor(%30)) /// markers have 30% transparency lfit Petal_Length Petal_Width), /// scheme (michigan)
Legend Placement
Sometimes you may wish to have the legend of the graph placed at the bottom of the graph. The pos(6) suboption inside the legend option will place the legend at the bottom, while you can manually control the number of legend rows with the rows suboption.
graph bar Petal_Length, over (Species) scheme (michigan) asyvars legend (pos(6) rows (1))
Individual Michigan Colors
Individual University of Michigan colors are listed below.
Blue #00274C
0 39 76
Maize #FFCB05
255 203 5
Tappan Red #9A3324
154 51 36
Ross School Orange #D86018
216 96 24
Rackham Green #75988d
117 152 141
Wave Field Green #A5A508
165 165 8
Taubman Teal #00B2A9
0 178 169
Arboretum Blue #2F65A7
47 101 167
Ann Arbor Amethyst #702082
112 32 130
Matthaei Violet #575294
87 82 148
UMMA Tan #CFC096
207 192 150
Burton Tower Beige #9B9A6D
155 154 109
Angell Hall Ash #989C97
152 156 151
Law Quad Stone #655A52
101 90 82
Stata can use RGB codes for colors. As an example.
twoway (scatter Petal_Length Petal_Width, mcolor("112 32 130 %30" )) /// markers are Amethyst with 30% transparency lfit Petal_Length Petal_Width, lcolor("87 82 148" )), /// Violet line scheme (michigan)