22 Mar 2024 11:27:46
Stata provides the use of graph schemes that improve the overall look of graphs.
See help scheme.
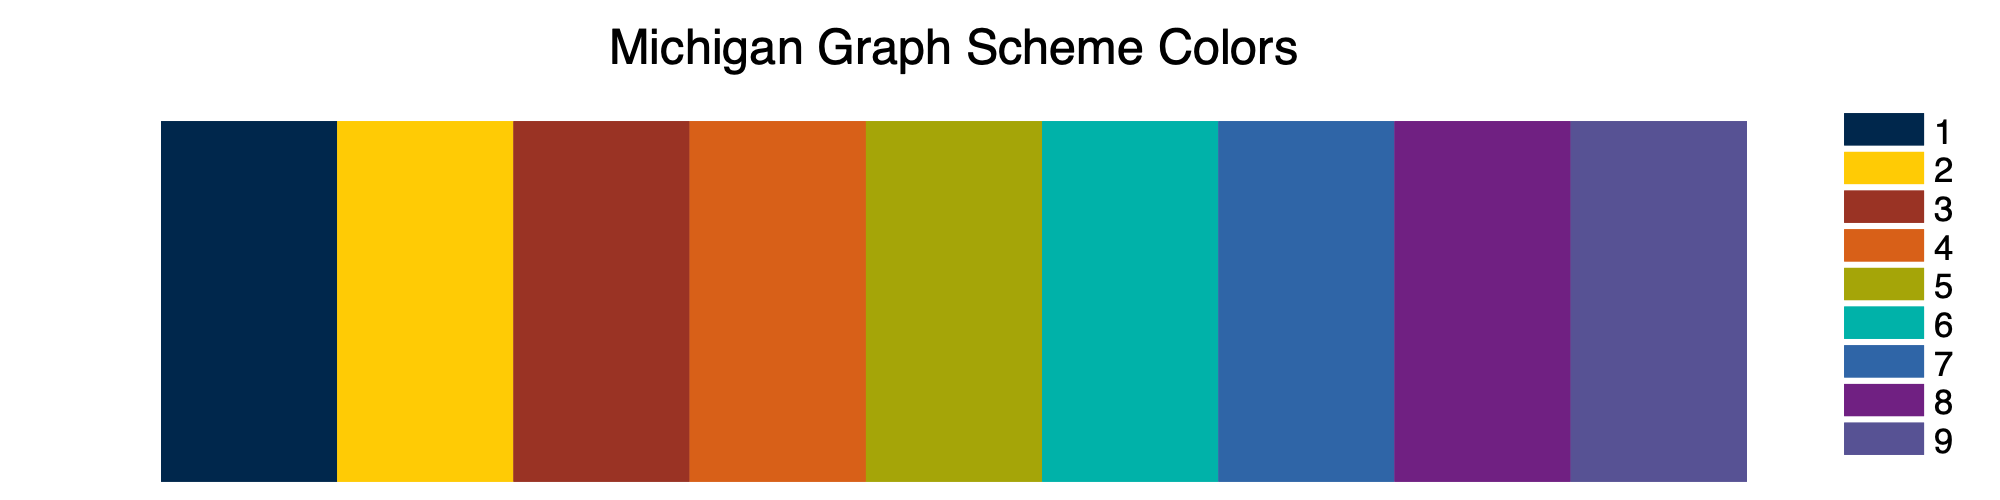
The Michigan graph scheme makes use of official University of Michigan colors.
Use of the Michigan graph scheme depends on installation of
the lean2 graph scheme developed by Svend Juul.
Type findit lean2 and click through on the install links
to install lean2.
Then type net from https://agrogan1.github.io/Stata and
click the links to install.
We are going to use the famous “iris” data collected by Edgar Anderson.
. clear all

.
. use "iris.dta", clear

.
. summarize

    Variable │        Obs        Mean    Std. dev.       Min        Max
─────────────┼─────────────────────────────────────────────────────────
Sepal_Length │        150    5.843333    .8280661        4.3        7.9
 Sepal_Width │        150    3.057333    .4358663          2        4.4
Petal_Length │        150       3.758    1.765298          1        6.9
 Petal_Width │        150    1.199333    .7622377         .1        2.5
     Species │        150           2    .8192319          1          3
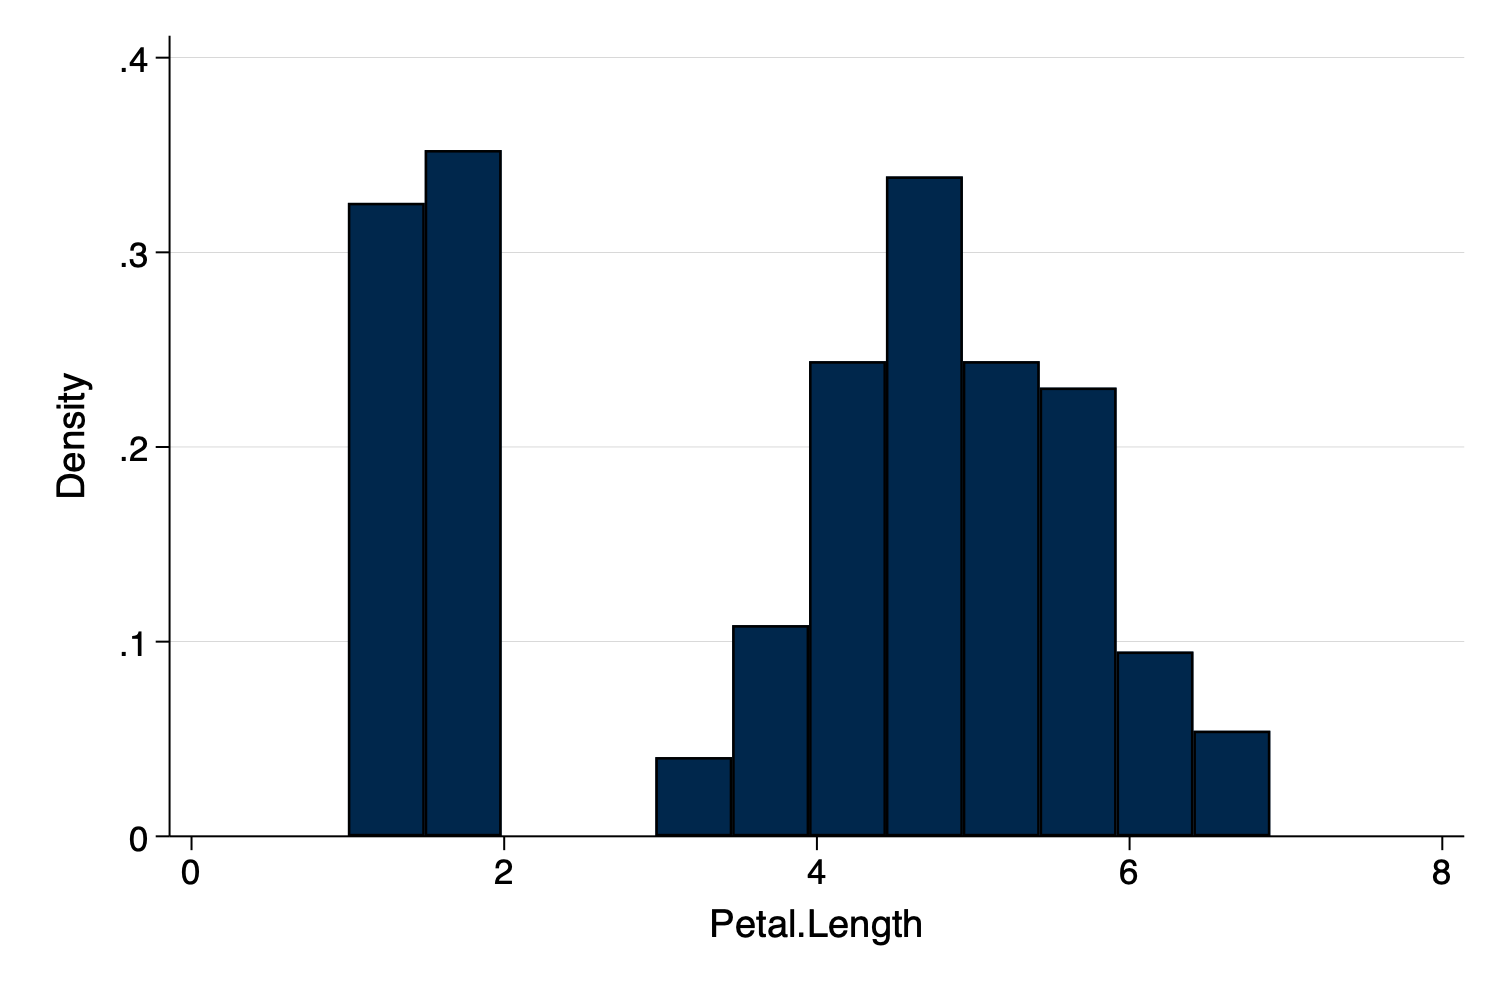
. histogram Petal_Length, scheme(michigan)
(bin=12, start=1, width=.49166667)
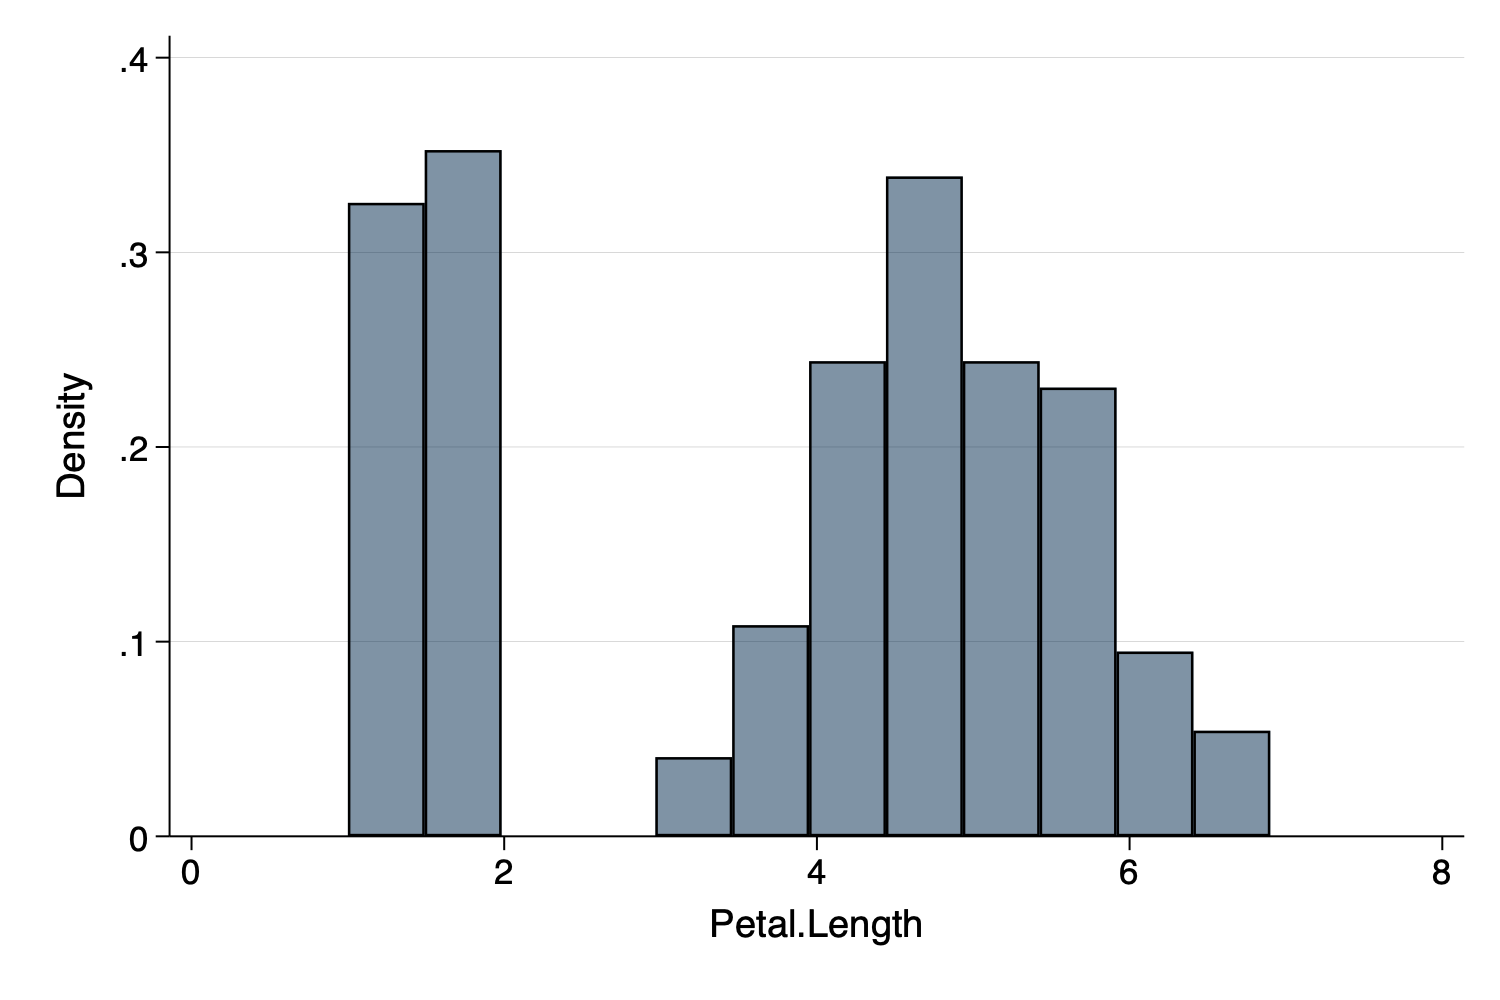
. histogram Petal_Length, fcolor(%50) scheme(michigan)
(bin=12, start=1, width=.49166667)
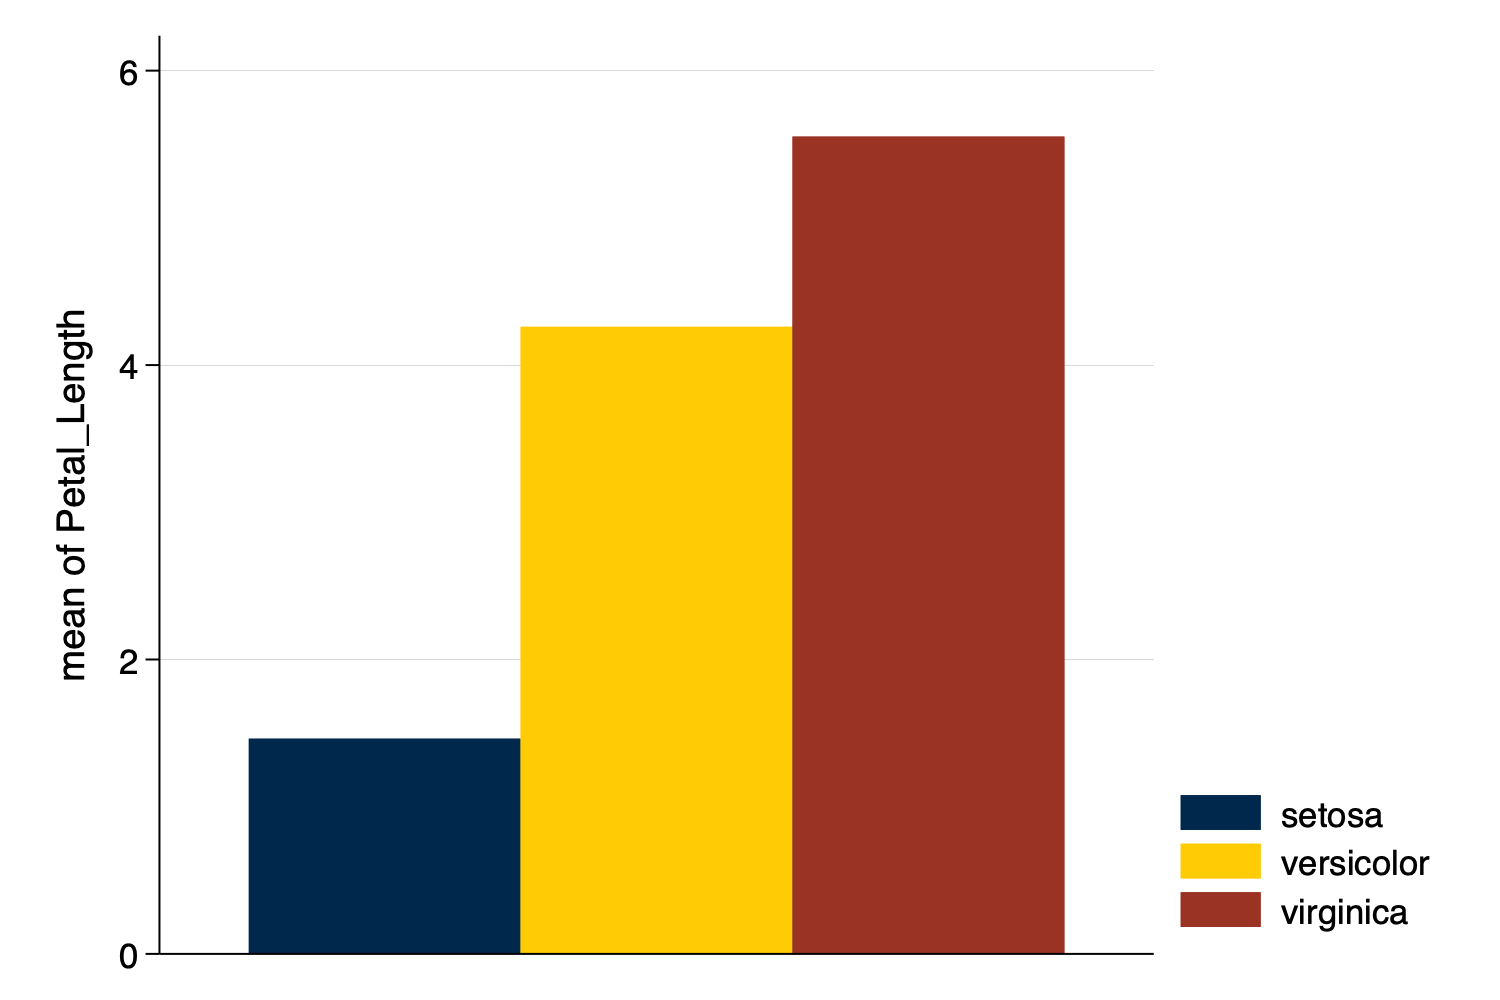
. graph bar Petal_Length, over(Species) scheme(michigan) asyvars
. graph bar Petal_Length, over(Species) intensity(70) scheme(michigan) asyvars

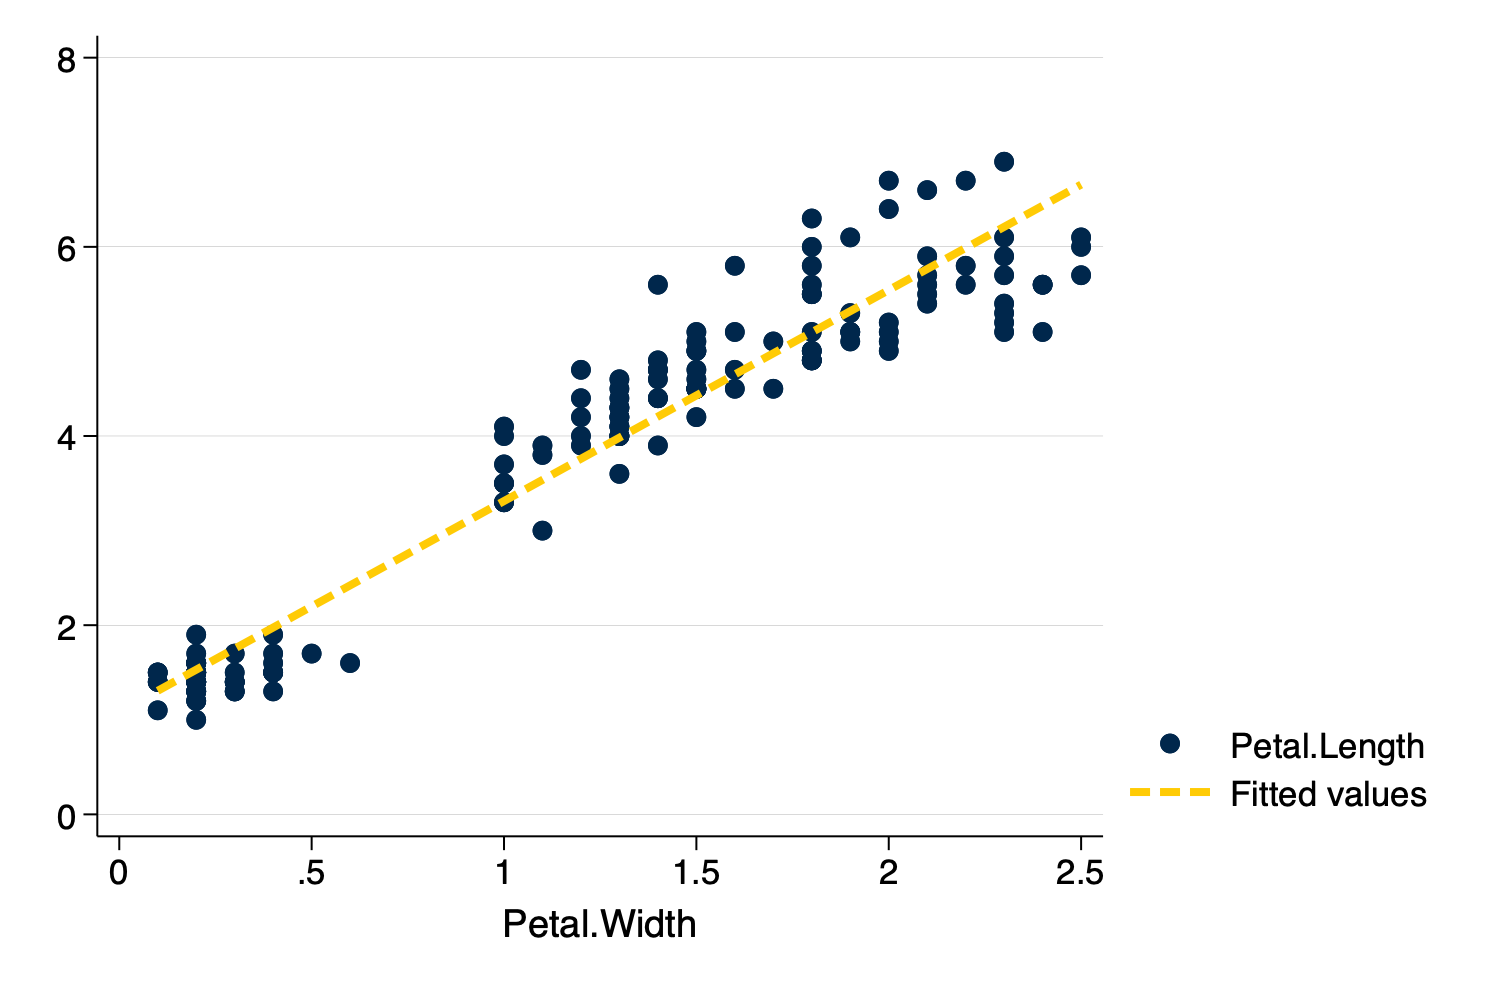
. twoway (scatter Petal_Length Petal_Width) ///
> (lfit Petal_Length Petal_Width), ///
> scheme(michigan)
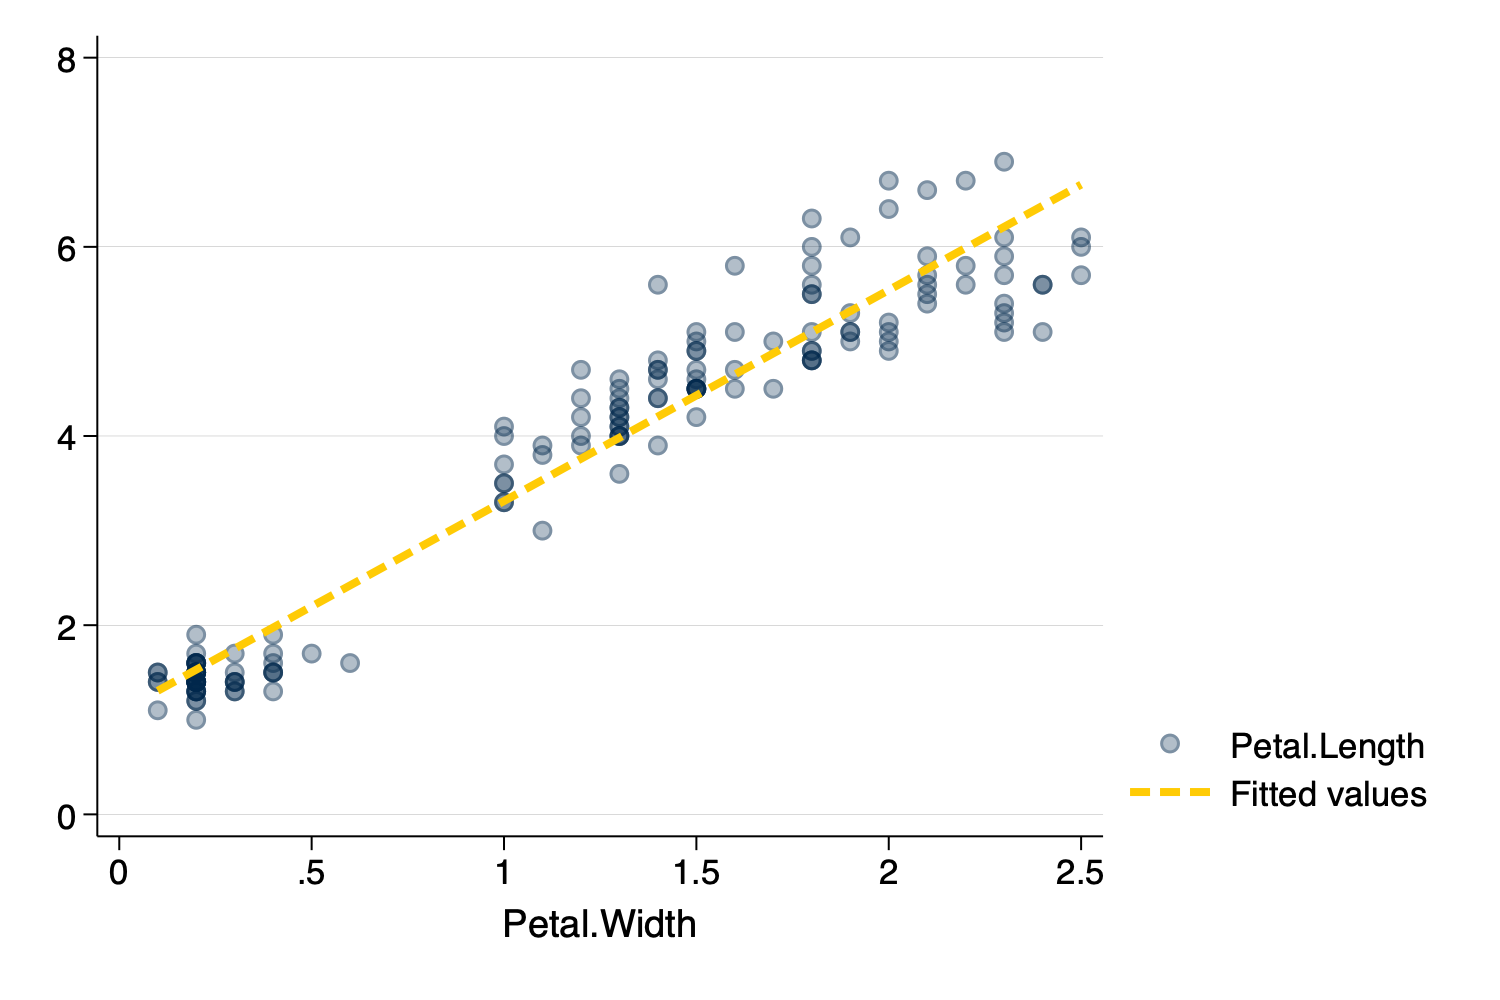
. twoway (scatter Petal_Length Petal_Width, mcolor(%30)) /// markers have 30% transpare
> ncy
> (lfit Petal_Length Petal_Width), ///
> scheme(michigan)
Sometimes you may wish to have the legend of the graph placed at the
bottom of the graph. The pos(6) suboption inside
the legend option will place the legend at the bottom,
while you can manually control the number of legend rows with the
rows suboption.
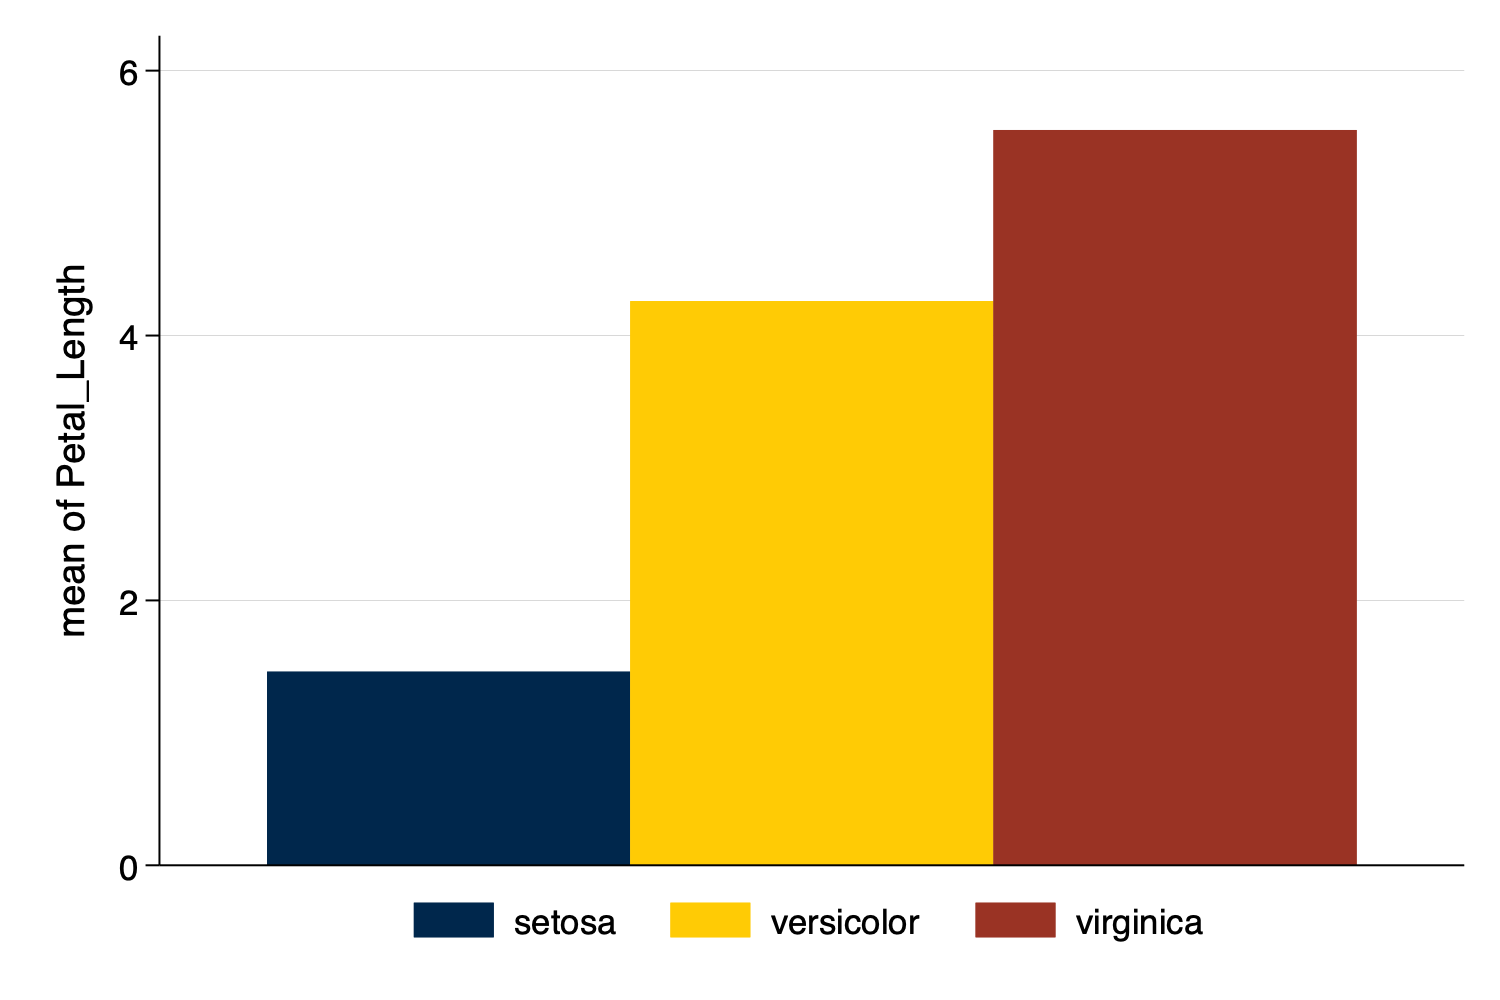
. graph bar Petal_Length, over(Species) scheme(michigan) asyvars legend(pos(6) rows(1))
Individual University of Michigan colors are listed below.
| Color | Hex | RGB |
|---|---|---|
| Blue | #00274C | 0 39 76 |
| Maize | #FFCB05 | 255 203 5 |
| Tappan Red | #9A3324 | 154 51 36 |
| Ross School Orange | #D86018 | 216 96 24 |
| Wave Field Green | #A5A508 | 165 165 8 |
| Taubman Teal | #00B2A9 | 0 178 169 |
| Arboretum Blue | #2F65A7 | 47 101 167 |
| Ann Arbor Amethyst | #702082 | 112 32 130 |
| Matthaei Violet | #575294 | 87 82 148 |
| Umma Tan | #CFC096 | 207 192 150 |
| Burton Tower Beige | #9B9A6D | 155 154 109 |
| Angell Hall Ash | #989C97 | 152 156 151 |
| Law Quad Stone | #655A52 | 101 90 82 |
Stata can use RGB codes for colors. As an example.
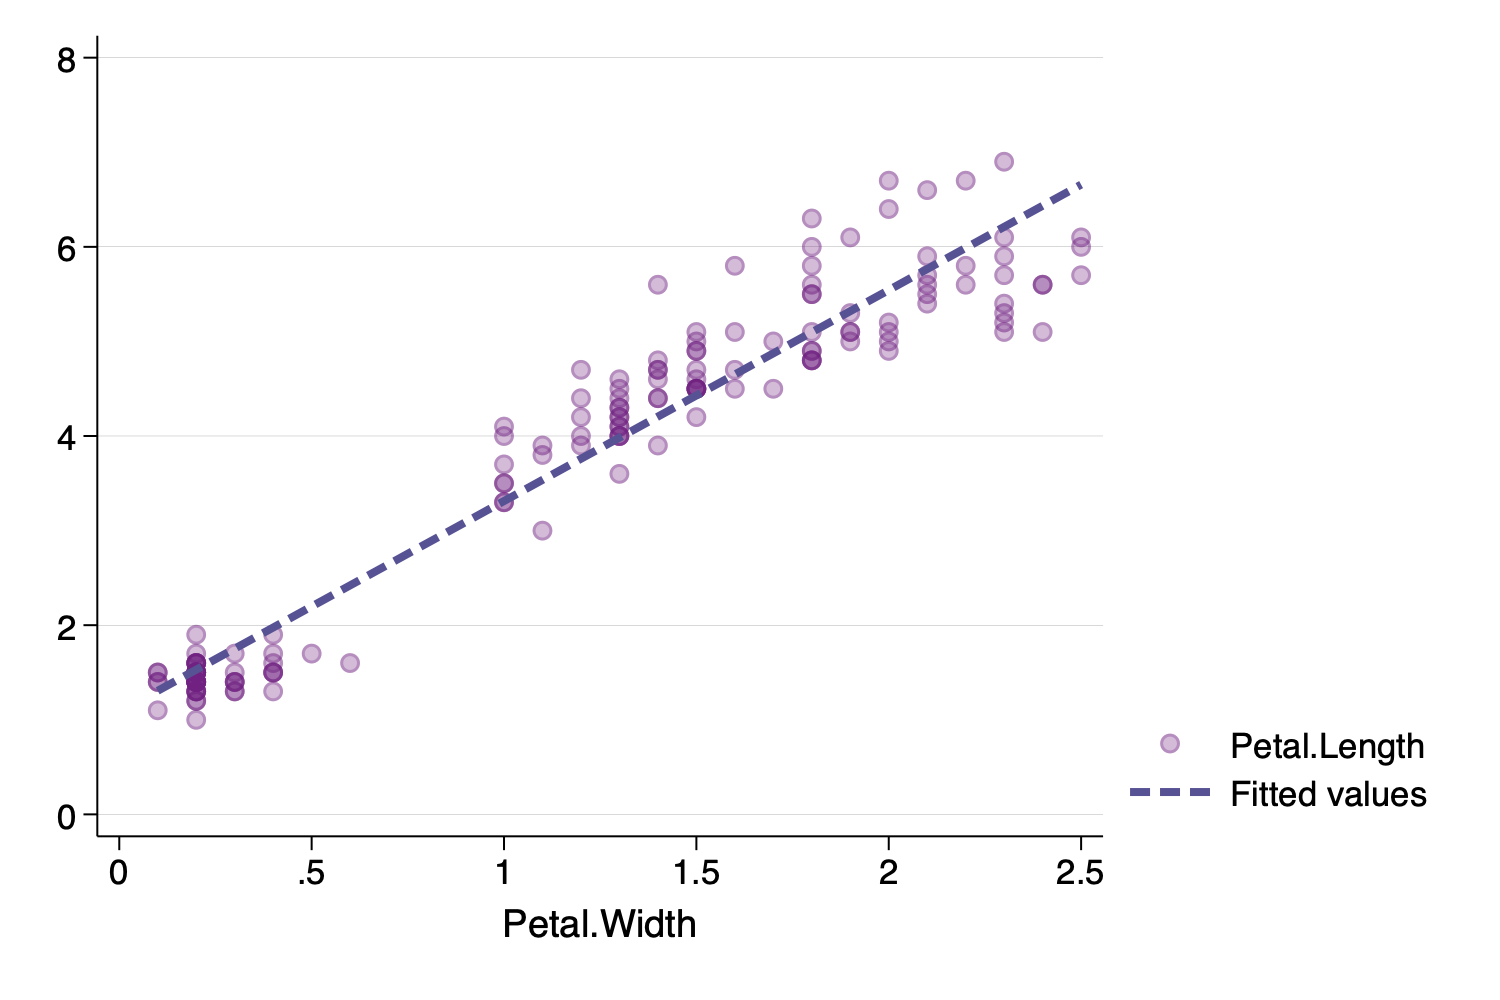
. twoway (scatter Petal_Length Petal_Width, mcolor("112 32 130 %30")) /// markers are A
> methyst with 30% transparency
> (lfit Petal_Length Petal_Width, lcolor("87 82 148")), /// Violet line
> scheme(michigan)
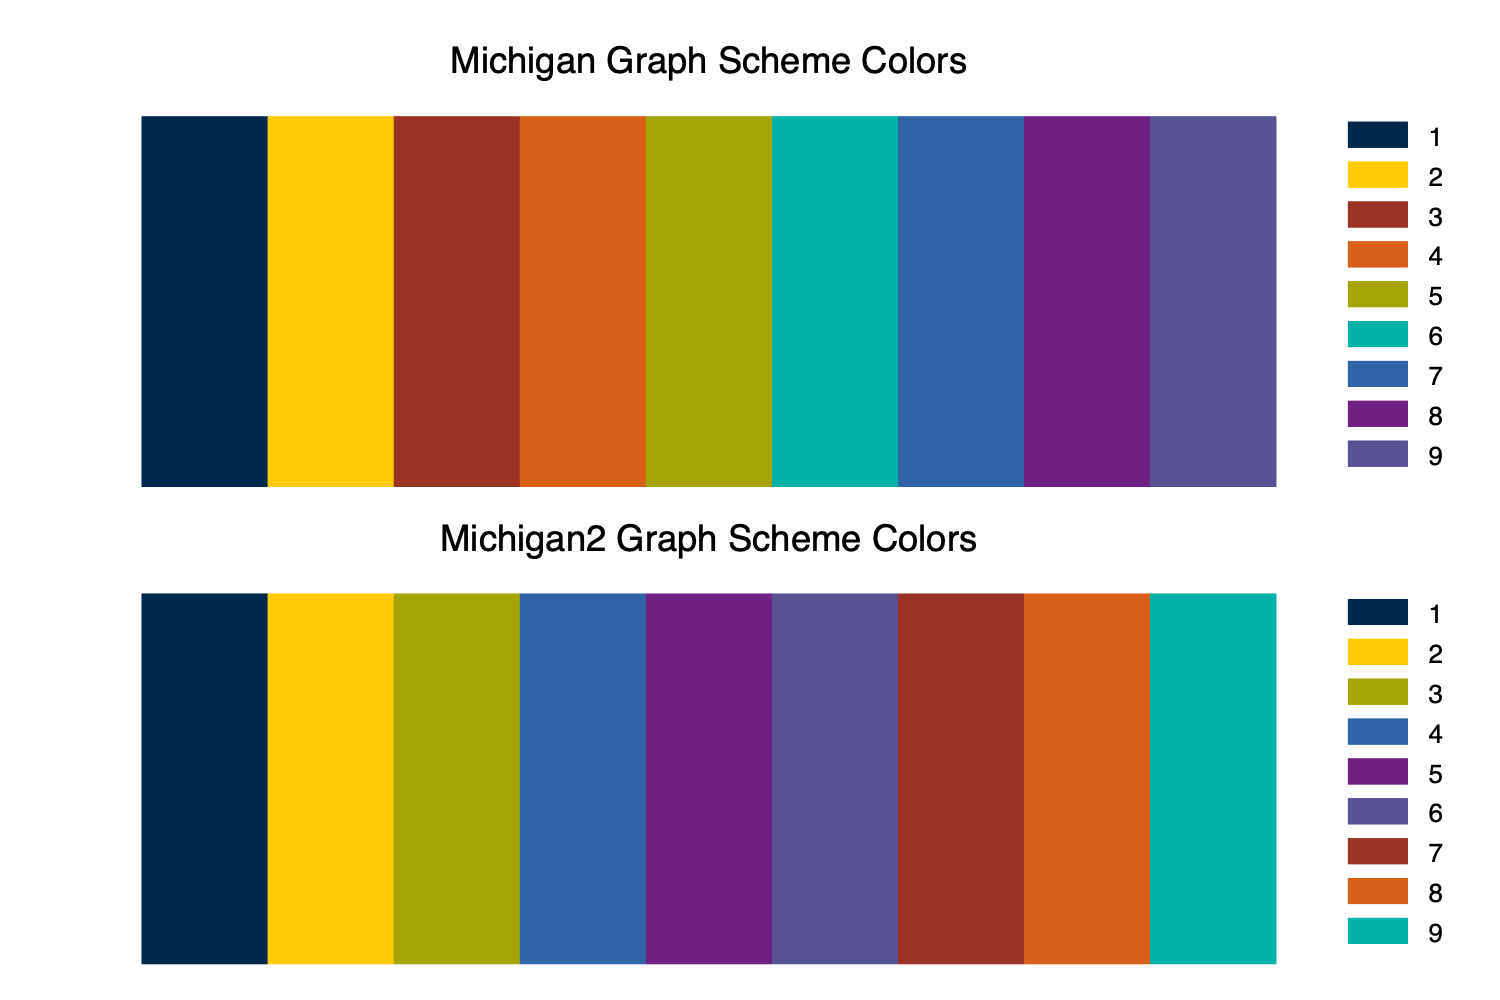
I have also developed a michigan2 graph scheme:
, scheme(michigan2).
This graph scheme can be installed using the same instructions as
above. The michigan2 scheme slightly reorders the color
palette of the original scheme. The scheme begins with blue and maize,
but then moves to the cooler colors before moving to Tappan
Red and Ross Orange. Taubman Teal–a very
fluorescent color–is moved to the end of the palette.