Use University of Michigan colors in graphs.
Usage
michigancolors(x = "all")
Arguments
- x
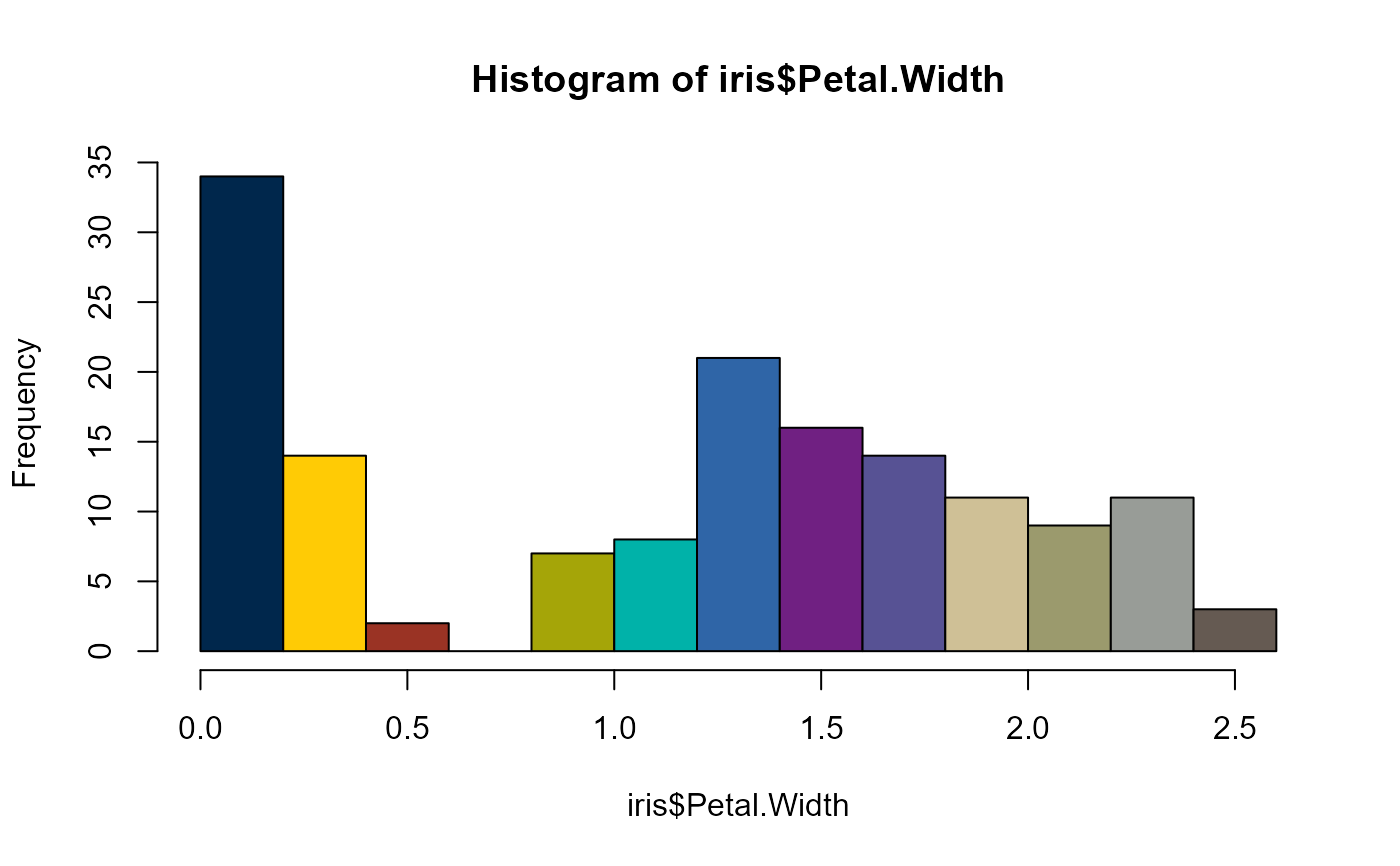
colors. Defaults to all. Allowable colors are: "blue", "maize", "tappan red", "ross school orange", "rackham green", "wave field green", "taubman teal", "arboretum blue", "ann arbor amethyst", "matthaei violet", "umma tan", "burton tower beige", "angell hall ash", and "law quad stone".
Examples
hist(iris$Petal.Width, col = michigancolors())

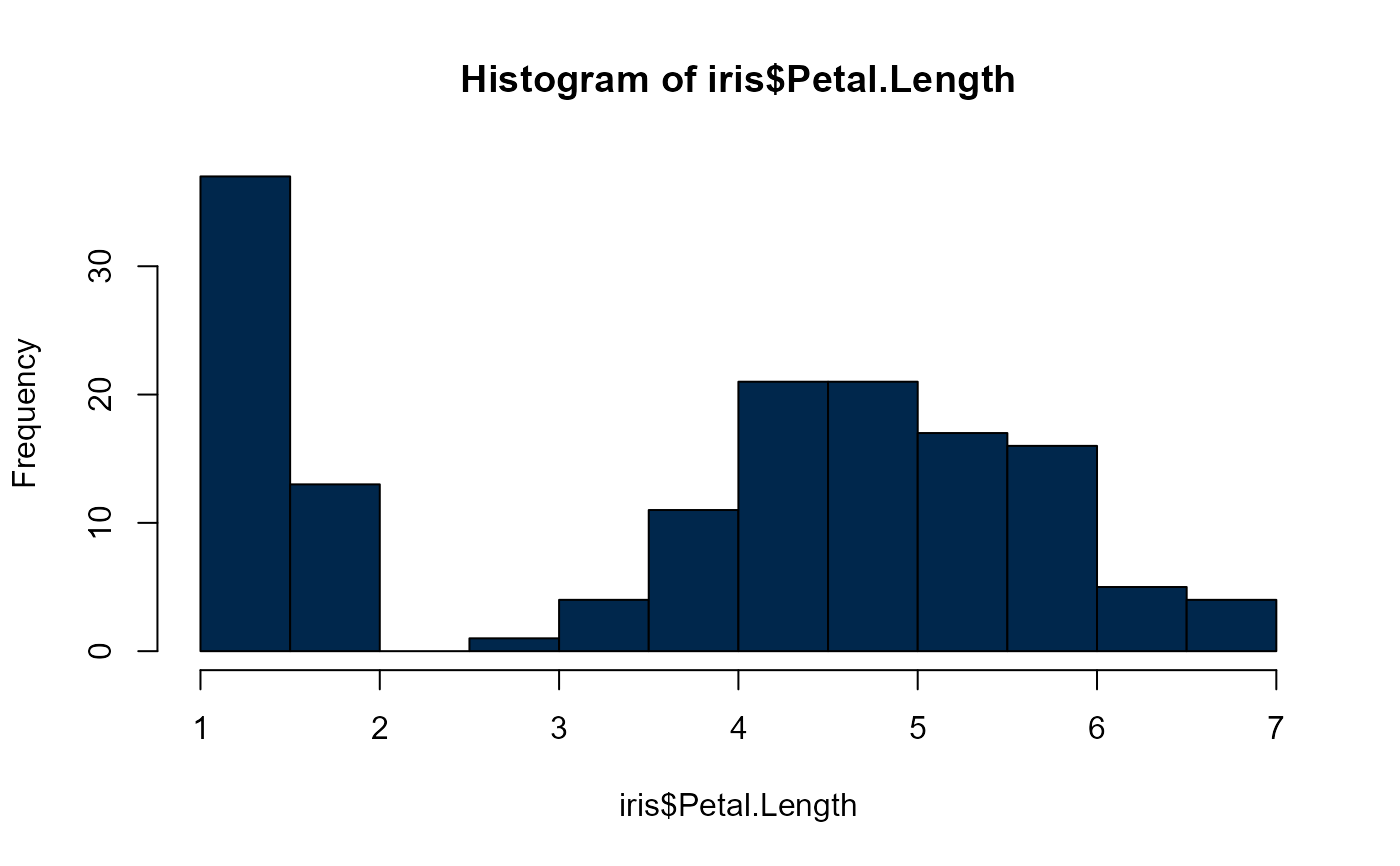
hist(iris$Petal.Length, col = michigancolors("blue"))

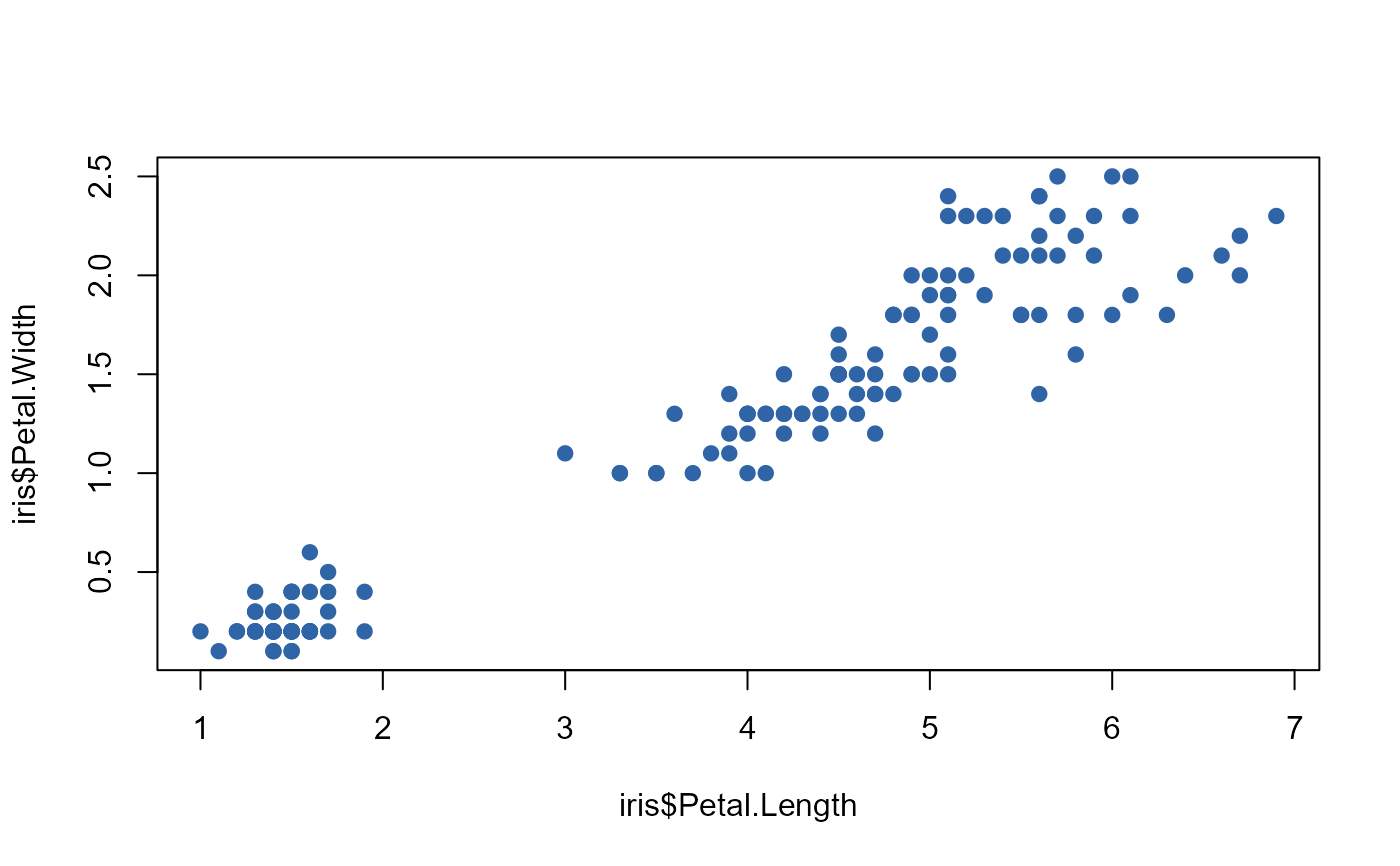
plot(iris$Petal.Length, iris$Petal.Width, col = michigancolors("tappan red"), pch = 19)
