Show the code
library(FAwR) # Forest Analytics with R

data("gutten") # Von Guttenberg Tree Datalmer Demo
Data are from von Guttenberg’s Norway spruce (Picea abies [L.] Karst) tree measurement data, from Robinson and Hamann (2020).
“The data are measures from 107 trees. The trees were selected as being of average size from healthy and well stocked stands in the Alps.”
library(FAwR) # Forest Analytics with R
data("gutten") # Von Guttenberg Tree Datasite Growth quality class of the tree’s habitat. 5 levels.
location Distinguishes tree location. 7 levels.
tree An identifier for the tree within location.
age.base The tree age taken at ground level.
height Tree height, m.
dbh.cm Tree diameter, cm.
volume Tree volume.
age.bh Tree age taken at 1.3 m.
tree.ID A factor uniquely identifying the tree.
gutten$height.C <- gutten$height - mean(gutten$height)

gutten$age.base.C <- gutten$age.base - mean(gutten$age.base) library(ggplot2)
library(patchwork)p_uncentered <- ggplot(gutten,
aes(x = age.base,
y = height,
color = tree.ID)) +
geom_line() +
labs(title = "Tree Height By Tree Age",
subtitle = "Uncentered Data") +
scale_color_viridis_d() +
theme_minimal() +
theme(legend.position = "none")
# p_uncentered
p_centered <- ggplot(gutten,
aes(x = age.base.C,
y = height.C,
color = tree.ID)) +
geom_line() +
labs(title = "Tree Height By Tree Age",
subtitle = "Centered Data") +
scale_color_viridis_d() +
theme_minimal() +
theme(legend.position = "none")
# p_centered
p_uncentered + p_centered 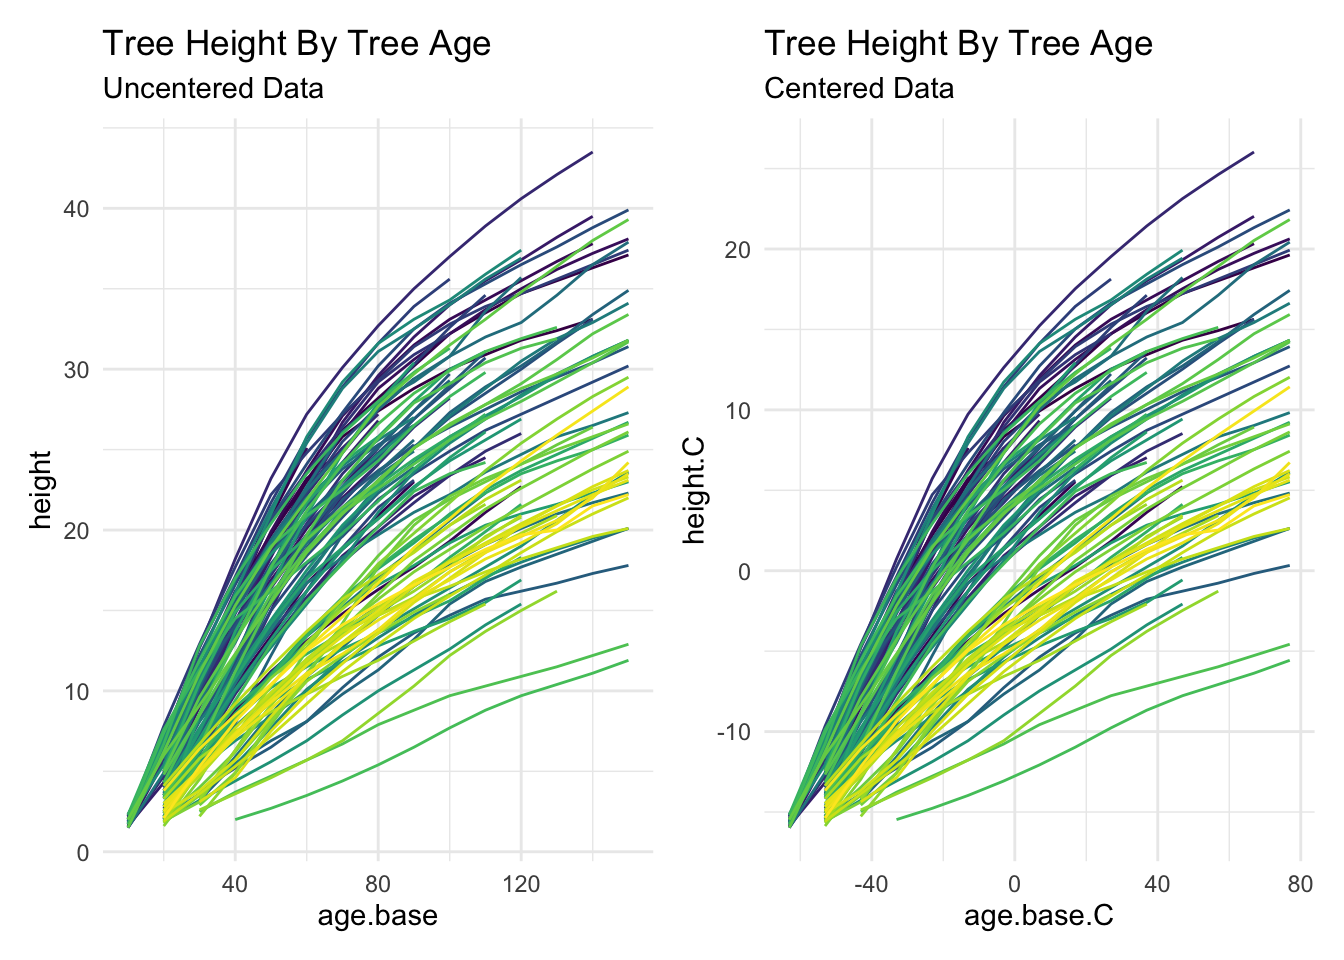
lmer 🌲library(lme4) # MLM
library(sjPlot) # nice tables for MLMfit0 <- lmer(height ~ (1 | tree.ID),
data = gutten)
tab_model(fit0)| height | |||
|---|---|---|---|
| Predictors | Estimates | CI | p |
| (Intercept) | 17.23 | 16.35 – 18.11 | <0.001 |
| Random Effects | |||
| σ2 | 69.70 | ||
| τ00 tree.ID | 15.08 | ||
| ICC | 0.18 | ||
| N tree.ID | 107 | ||
| Observations | 1200 | ||
| Marginal R2 / Conditional R2 | 0.000 / 0.178 | ||
fit1 <- lmer(height ~ age.base + (1 | tree.ID),
             data = gutten)

tab_model(fit1)| height | |||
|---|---|---|---|
| Predictors | Estimates | CI | p |
| (Intercept) | 2.10 | 1.07 – 3.13 | <0.001 |
| age base | 0.21 | 0.21 – 0.22 | <0.001 |
| Random Effects | |||
| σ2 | 8.41 | ||
| τ00 tree.ID | 25.75 | ||
| ICC | 0.75 | ||
| N tree.ID | 107 | ||
| Observations | 1200 | ||
| Marginal R2 / Conditional R2 | 0.654 / 0.915 | ||