use gutten.dta, clearMultilevel Models with the Von Guttenberg Tree Data
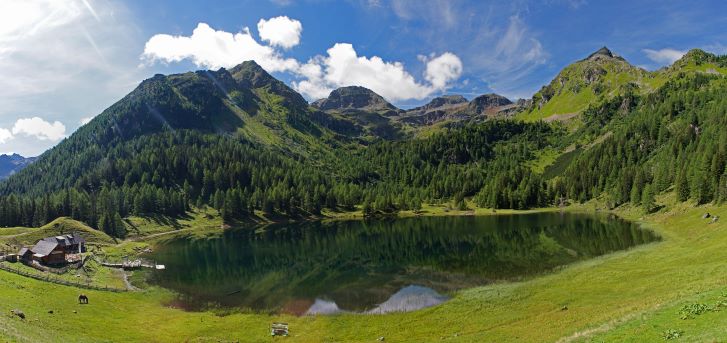
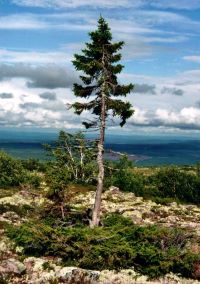
Figure Credit: https://ec.europa.eu/jrc/en/research-topic/forestry/qr-tree-project/norway-spruce

1 Data Source 🌲
The data used in this example are derived from the R package Functions and Datasets for “Forest Analytics with R”.
According to the documentation, the source of these data are: “von Guttenberg’s Norway spruce (Picea abies [L.] Karst) tree measurement data.”
The documentation goes on to further note that:
“The data are measures from 107 trees. The trees were selected as being of average size from healthy and well stocked stands in the Alps.”
use "https://github.com/agrogan1/multilevel/raw/master/mlm-R2-gutten/gutten.dta", clear should work to obtain the data over the web. Please let me know if it does not.
2 Variables 🌲
site Growth quality class of the tree’s habitat. 5 levels.
location Distinguishes tree location. 7 levels.
tree An identifier for the tree within location.
age_base The tree age taken at ground level.
It might be best to use a centered age variable, centered at the grand mean of tree age:
egen ageMEAN = mean(age_base) // mean value

generate ageCENTERED = age_base - ageMEAN // centered value
height Tree height, m.
dbh_cm Tree diameter, cm.
volume Tree volume.
age_bh Tree age taken at 1.3 m.
tree_ID A factor uniquely identifying the tree.
3 Your Quantitative Forestry Tasks (Should You Choose To Accept Them) 🌲
I clearly need to learn more about quantitative approaches to forestry, but I would like to model tree height as a function of tree age (measured at base), site, and location.
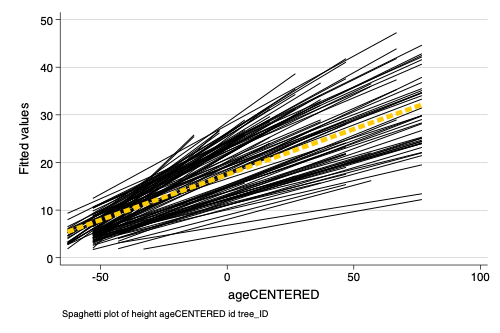
4 Spaghetti Plot 🌲
Use spagplot to examine these relationships. Remember that the spagplot syntax is spagplot y x, id(id). What is the most appropriate id variable here?
spagplotcan now be difficult to find, but for the time being, you can find it by typingnet from https://agrogan1.github.io/multilevel/spagplotin Stata.
spagplot height ageCENTERED, id(tree_ID)

graph export myspagplot.png, width(2000) replace
file /Users/agrogan/Desktop/GitHub/multilevel/mlm-gutten/myspagplot.png saved as
PNG formatspagplot height ageCENTERED, id(tree_ID) scheme(s1rcolor) also works well here.
5 Multilevel Models 🌲
5.1 Unconditional Model
Run an unconditional model with mixed. What Stata syntax do you use? What is the corresponding equation? What question is this syntax and equation asking and answering? Calculate the ICC. What does this number tell you?
5.2 Conditional Model
Now run a model with mixed where you examine the relationship of tree age, site, and location with tree height. Do any of your variables need to be treated as indicator (i.) variables?
What Stata syntax do you use? What is the corresponding equation? What question is this syntax and equation asking and answering? What do you find?
Quadratic Term?
What if you examine \((\text{age of tree})^2\) as part of your model?
generate ageMEAN2 = ageMEAN^2
Conditional ICC
Does the ICC have any meaning after your conditional model?