Show the code
library(haven) # read Stata

imm23 <- read_dta("https://stats.idre.ucla.edu/stat/examples/imm/imm23.dta")ggplotUsing example data from https://stats.oarc.ucla.edu/other/examples/imm/
library(haven) # read Stata
imm23 <- read_dta("https://stats.idre.ucla.edu/stat/examples/imm/imm23.dta")library(ggplot2)
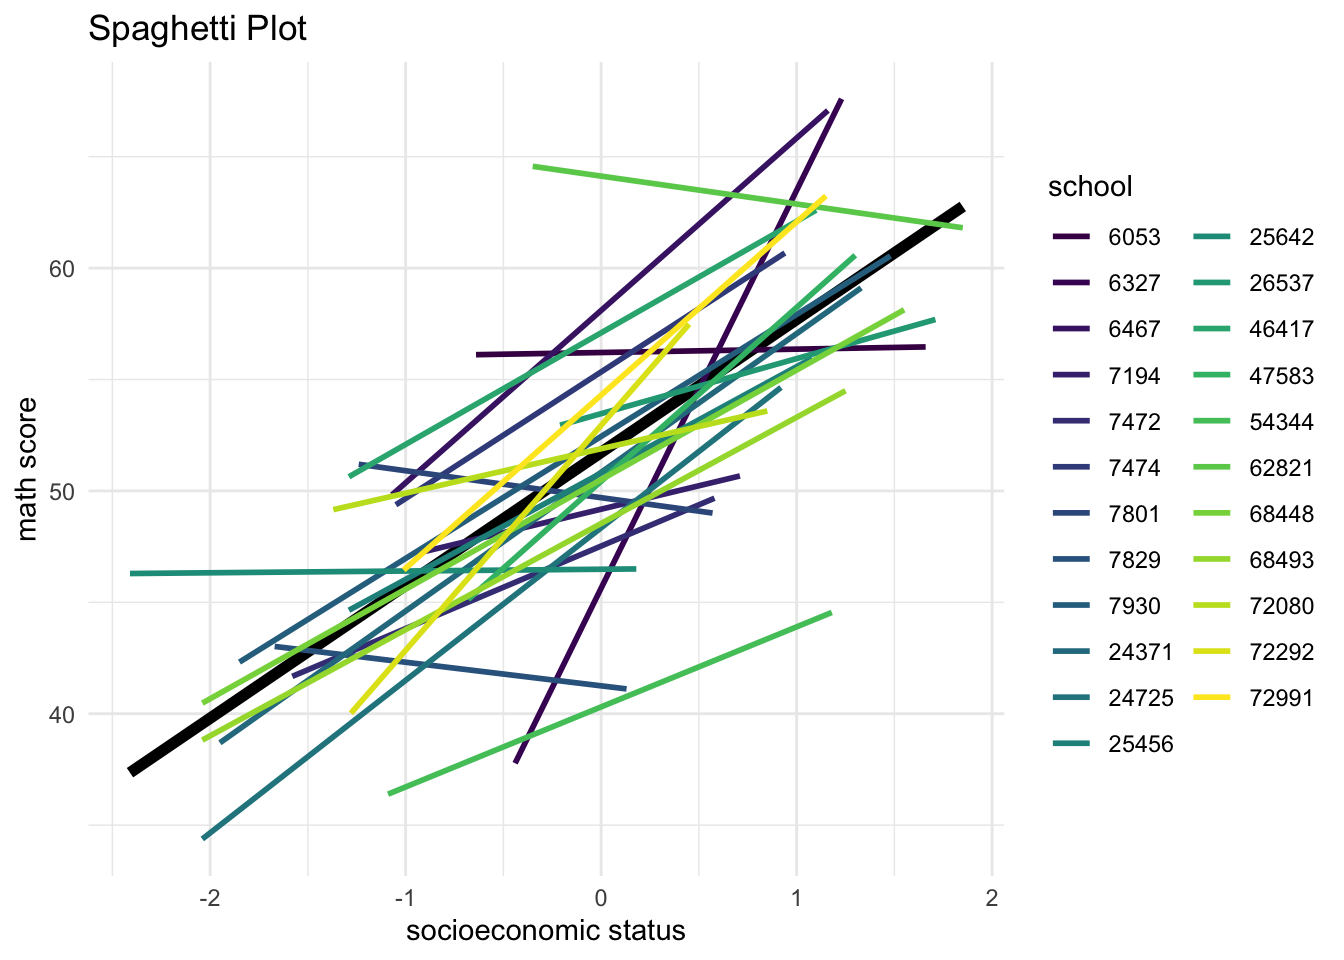
ggplot(imm23, # data I am using
aes(x = ses, # x is ses
y = math)) + # y is math achievement
geom_smooth(method = "lm", # linear model smoother for whole sample
linewidth = 2,
color = "black",
se = FALSE) + # no CI's
geom_smooth(aes(color = factor(schid)), # school specific linear smoother
method = "lm", # linear model
se = FALSE) + # no CI's
labs(title = "Spaghetti Plot",
x = "socioeconomic status",
y = "math score") +
# scale_color_discrete(name = "school") +
scale_color_viridis_d(name = "school") + # nice viridis colors
theme_minimal()