Bayesian Categorical Data Analysis
Andy Grogan-Kaylor
Andy Grogan-Kaylor
27 Nov 2020 11:02:13
More About Priors From SAS Corporation
“In addition to data, analysts often have at their disposal useful auxiliary information about inputs into their model—for example, knowledge that high prices typically decrease demand or that sunny weather increases outdoor mall foot traffic. If used and incorporated correctly into the analysis, the auxiliary information can significantly improve the quality of the analysis. But this information is often ignored. Bayesian analysis provides a principled means of incorporating this information into the model through the prior distribution, but it does not provide a road map for translating auxiliary information into a useful prior.”
–SAS Corporation
Applying the Derivation to Data Analysis
| Hypothesis |
\(P(D, H)\) |
\(P(\text{not} D, H)\) |
| Not Hypothesis |
\(P(D, \text{not} H)\) |
\(P(\text{not} D, \text{not} H)\) |
From the definition of conditional probability:
\(P(D|H) = P(D,H) / P(H)\)
\(P(H|D) = P(D,H) / P(D)\)
Then:
\(P(D|H)P(H) = P(D,H)\)
\(P(H|D)P(D) = P(D,H)\)
Then:
\(P(D|H)P(H) = P(H|D)P(D)\)
Then:
\(P(H|D) = \frac{P(D|H)P(H)}{P(D)}\)
\(\text{posterior} \sim \text{likelihood} \times \text{prior}\)
Accepting the Null Hypothesis
We Are Directly Estimating The Probability of the Hypothesis Given The Data
- Could be large e.g. .8.
- Could be small e.g. .1.
- Could be effectively 0. (Essentially, we can accept a null hypothesis)
We Are Not Rejecting a Null Hypothesis
We are not imagining a hypothetical null hypothesis (that may not even be substantively meaningful), and asking the question of whether the data we observe are extreme enough that we wish to reject this null hypothesis.
- \(H_0\): \(\bar{x} = 0\) or \(\beta = 0\)
- Posit \(H_A\): \(\bar{x} \neq 0\) or \(\beta \neq 0\)
- Observe data and calculate a test statistic (e.g. \(t\)). If \(\text{test statistic} > \text{critical value}\), e.g. \(t > 1.96\) then reject \(H_0\).
- We can never accept \(H_0\), only reject \(H_A\).
Accepting Null Hypotheses
What is the effect on science and publication of having a statistical practice where we can never affirm \(\bar{x} = 0\) or \(\beta = 0\), but only reject \(\bar{x} = 0\) or \(\beta = 0\)?
- Only affirm difference not similarity
- Publication bias
See https://agrogan1.github.io/Bayes/accepting-H0/accepting-H0.html
Bayesian statistics allow us to accept the null hypothesis \(H_0\).
Bayesian Categorical Data Analysis in Stata
. set seed 1234 // setting random seed is important!!!
. use "../logistic-regression/GSSsmall.dta", clear
Frequentist Logistic Regression
. logit liberal i.race i.class

Iteration 0:   log likelihood = -31538.733
Iteration 1:   log likelihood = -31370.507
Iteration 2:   log likelihood = -31369.841
Iteration 3:   log likelihood = -31369.841

Logistic regression                             Number of obs     =     53,625
                                                LR chi2(5)        =     337.78
                                                Prob > chi2       =     0.0000
Log likelihood = -31369.841                     Pseudo R2         =     0.0054

───────────────┬────────────────────────────────────────────────────────────────
       liberal │      Coef.   Std. Err.      z    P>|z|     [95% Conf. Interval]
───────────────┼────────────────────────────────────────────────────────────────
          race │
        black  │   .4443531   .0272062    16.33   0.000       .39103    .4976762
        other  │   .3190896   .0413275     7.72   0.000     .2380891    .4000901
               │
         class │
working class  │  -.1397848    .041515    -3.37   0.001    -.2211527   -.0584169
 middle class  │  -.0117948   .0416509    -0.28   0.777     -.093429    .0698394
  upper class  │   .1512565   .0648962     2.33   0.020     .0240624    .2784507
               │
         _cons │  -.9900441   .0397384   -24.91   0.000     -1.06793   -.9121582
───────────────┴────────────────────────────────────────────────────────────────
Bayesian Logistic Regression
Takes a few minutes since using MCMC (5-10 minutes).
. sample 10 // Random Sample To Speed This Example: DON'T DO THIS IN PRACTICE!!!
(58,332 observations deleted)
How do we interpret the result for some of the social class categories where the credibility interval includes 0?
. bayes: logit liberal i.race i.class

Burn-in ...
Simulation ...

Model summary
────────────────────────────────────────────────────────────────────────────────
Likelihood:
  liberal ~ logit(xb_liberal)

Prior:
  {liberal:i.race i.class _cons} ~ normal(0,10000)                           (1)
────────────────────────────────────────────────────────────────────────────────
(1) Parameters are elements of the linear form xb_liberal.

Bayesian logistic regression                       MCMC iterations  =     12,500
Random-walk Metropolis-Hastings sampling           Burn-in          =      2,500
                                                   MCMC sample size =     10,000
                                                   Number of obs    =      5,376
                                                   Acceptance rate  =      .2312
                                                   Efficiency:  min =     .01541
                                                                avg =     .03017
Log marginal likelihood = -3193.2465                            max =     .05577

───────────────┬────────────────────────────────────────────────────────────────
               │                                                Equal-tailed
       liberal │      Mean   Std. Dev.     MCSE     Median  [95% Cred. Interval]
───────────────┼────────────────────────────────────────────────────────────────
          race │
        black  │  .5186618   .0888498   .005436   .5162073   .3446927   .6905559
        other  │  .3315087   .1318099   .006538   .3340969   .0778656   .5812581
               │
         class │
working class  │ -.2257059   .1359429    .01095  -.2304211  -.4719162   .0560403
 middle class  │ -.2159555   .1280385   .008659  -.2177452  -.4572864   .0353198
  upper class  │  .1385091   .2119785   .008976   .1421824  -.2664372   .5469788
               │
         _cons │ -.8561818   .1277022   .008896  -.8537522  -1.104622  -.6151415
───────────────┴────────────────────────────────────────────────────────────────
Note: Default priors are used for model parameters.
Blocking May Improve Estimation
. * bayes, block({liberal:i.race}): logit liberal i.race i.class // blocking may improve estimatio
> n
Bayesian Logistic Regression With Priors
Priors:
- Encode prior information: strong theory; strong clinical or practice wisdom; strong previous empirical results.
- May be helpful in quantitatively encoding the results of prior literature.
- May be especially helpful when your sample is small.
. bayes, normalprior(5): logit liberal i.race i.class

Burn-in ...
Simulation ...

Model summary
────────────────────────────────────────────────────────────────────────────────
Likelihood:
  liberal ~ logit(xb_liberal)

Prior:
  {liberal:i.race i.class _cons} ~ normal(0,25)                              (1)
────────────────────────────────────────────────────────────────────────────────
(1) Parameters are elements of the linear form xb_liberal.

Bayesian logistic regression                       MCMC iterations  =     12,500
Random-walk Metropolis-Hastings sampling           Burn-in          =      2,500
                                                   MCMC sample size =     10,000
                                                   Number of obs    =      5,376
                                                   Acceptance rate  =      .2296
                                                   Efficiency:  min =     .02373
                                                                avg =     .03808
Log marginal likelihood = -3175.5153                            max =     .05215

───────────────┬────────────────────────────────────────────────────────────────
               │                                                Equal-tailed
       liberal │      Mean   Std. Dev.     MCSE     Median  [95% Cred. Interval]
───────────────┼────────────────────────────────────────────────────────────────
          race │
        black  │  .5156108   .0846052   .003705   .5165275   .3428716   .6703037
        other  │  .3494915   .1292596   .007216   .3517041   .0891921   .6044571
               │
         class │
working class  │ -.2177134   .1271378   .005941  -.2191734  -.4736636   .0299706
 middle class  │ -.2111361   .1279262   .006815   -.209842  -.4649101   .0467745
  upper class  │  .1408649   .2085374   .013539   .1413301  -.2595456   .5542024
               │
         _cons │ -.8599554   .1222741   .006154  -.8616087  -1.102605   -.620957
───────────────┴────────────────────────────────────────────────────────────────
Note: Default priors are used for model parameters.
MCMC vs. ML
. set obs 100
number of observations (_N) was 0, now 100
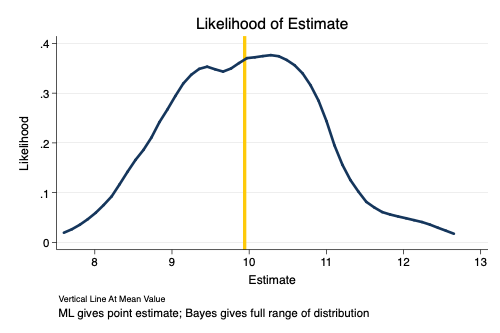
. generate myestimate = rnormal() + 10 // simulated values of estimate
. summarize myestimate

    Variable │        Obs        Mean    Std. Dev.       Min        Max
─────────────┼─────────────────────────────────────────────────────────
  myestimate │        100     9.94191    .9294447   7.932717   12.31949
. kdensity myestimate ,  ///
> title("Likelihood of Estimate") ///
> xtitle("Estimate") ytitle("Likelihood") ///
> note("Vertical Line At Mean Value") ///
> caption("ML gives point estimate; Bayes gives full range of distribution") ///
> xline(`mymean', lwidth(1) lcolor(gold)) scheme(michigan)
. graph export MCMC-ML.png, width(500) replace
(file MCMC-ML.png written in PNG format)
Full Distribution of Parameters
. use "../logistic-regression/GSSsmall.dta", clear
. sample 10 // Random Sample for These Slides: DON'T DO THIS IN PRACTICE!!!
(58,332 observations deleted)
. bayes, normalprior(5): logit liberal i.race i.class

Burn-in ...
Simulation ...

Model summary
────────────────────────────────────────────────────────────────────────────────
Likelihood:
  liberal ~ logit(xb_liberal)

Prior:
  {liberal:i.race i.class _cons} ~ normal(0,25)                              (1)
────────────────────────────────────────────────────────────────────────────────
(1) Parameters are elements of the linear form xb_liberal.

Bayesian logistic regression                       MCMC iterations  =     12,500
Random-walk Metropolis-Hastings sampling           Burn-in          =      2,500
                                                   MCMC sample size =     10,000
                                                   Number of obs    =      5,383
                                                   Acceptance rate  =      .2236
                                                   Efficiency:  min =     .02256
                                                                avg =     .03414
Log marginal likelihood = -3177.2034                            max =     .05443

───────────────┬────────────────────────────────────────────────────────────────
               │                                                Equal-tailed
       liberal │      Mean   Std. Dev.     MCSE     Median  [95% Cred. Interval]
───────────────┼────────────────────────────────────────────────────────────────
          race │
        black  │  .4851672   .0829121   .004159   .4879013   .3172142   .6439872
        other  │  .0424599    .135287   .005799   .0432961   -.223915   .3134179
               │
         class │
working class  │ -.3129757   .1321655     .0088  -.3171116  -.5767932  -.0470307
 middle class  │ -.2267685   .1281627   .008449  -.2287587  -.4673167   .0249752
  upper class  │ -.1154092   .2013339   .010816  -.1178767  -.5131633   .2788442
               │
         _cons │ -.7892161   .1229919   .007051  -.7913504  -1.037607  -.5534833
───────────────┴────────────────────────────────────────────────────────────────
Note: Default priors are used for model parameters.
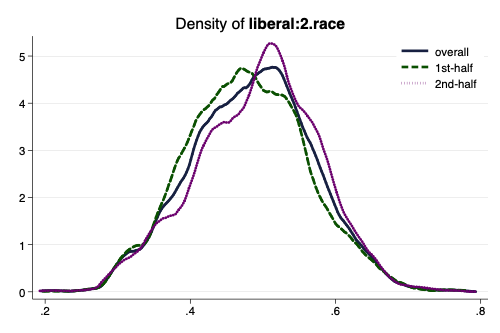
. bayesgraph kdensity {liberal:2.race}, scheme(michigan)
. graph export mybayesgraph.png, width(500) replace
(file mybayesgraph.png written in PNG format)

