use https://www.stata-press.com/data/r18/lbw(Hosmer & Lemeshow data)Logistic regression might be considered to be a classification algorithm, as logistic regression provides predicted probabilities of an outcome. An important part of using any classification algorithm is evaluating the strength of the classification.
Classification matrices, sometimes (confusingly) called confusion matrices, provide a mechanism for evaluating many different statistical and machine learning methods.
We use data from Hosmer et al. (2013) provided by Stata corporation.
use https://www.stata-press.com/data/r18/lbw(Hosmer & Lemeshow data)
describe // describe the dataRunning /Users/agrogan/Desktop/GitHub/newstuff/categorical/classification/profile.do
> ...
Contains data from https://www.stata-press.com/data/r18/lbw.dta
Observations: 189 Hosmer & Lemeshow data
Variables: 11 15 Jan 2022 05:01
-------------------------------------------------------------------------------------
Variable Storage Display Value
name type format label Variable label
-------------------------------------------------------------------------------------
id int %8.0g Identification code
low byte %8.0g Birthweight<2500g
age byte %8.0g Age of mother
lwt int %8.0g Weight at last menstrual period
race byte %8.0g race Race
smoke byte %9.0g smoke Smoked during pregnancy
ptl byte %8.0g Premature labor history (count)
ht byte %8.0g Has history of hypertension
ui byte %8.0g Presence, uterine irritability
ftv byte %8.0g Number of visits to physician during
1st trimester
bwt int %8.0g Birthweight (grams)
-------------------------------------------------------------------------------------
Sorted by: We are going to use logistic regression to predict low birthweight. We will then use a classification matrix to study the accuracy of these predictions.
logit low age lwt i.race smoke ptl ht ui, or // logistic regressionRunning /Users/agrogan/Desktop/GitHub/newstuff/categorical/classification/profile.do
> ...
Iteration 0: Log likelihood = -117.336
Iteration 1: Log likelihood = -101.28644
Iteration 2: Log likelihood = -100.72617
Iteration 3: Log likelihood = -100.724
Iteration 4: Log likelihood = -100.724
Logistic regression Number of obs = 189
LR chi2(8) = 33.22
Prob > chi2 = 0.0001
Log likelihood = -100.724 Pseudo R2 = 0.1416
------------------------------------------------------------------------------
low | Odds ratio Std. err. z P>|z| [95% conf. interval]
-------------+----------------------------------------------------------------
age | .9732636 .0354759 -0.74 0.457 .9061578 1.045339
lwt | .9849634 .0068217 -2.19 0.029 .9716834 .9984249
|
race |
Black | 3.534767 1.860737 2.40 0.016 1.259736 9.918406
Other | 2.368079 1.039949 1.96 0.050 1.001356 5.600207
|
smoke | 2.517698 1.00916 2.30 0.021 1.147676 5.523162
ptl | 1.719161 .5952579 1.56 0.118 .8721455 3.388787
ht | 6.249602 4.322408 2.65 0.008 1.611152 24.24199
ui | 2.1351 .9808153 1.65 0.099 .8677528 5.2534
_cons | 1.586014 1.910496 0.38 0.702 .1496092 16.8134
------------------------------------------------------------------------------
Note: _cons estimates baseline odds.The quantities of interest will often depend upon your discipline, and upon the specific research question.
However, the overall accuracy (correctly classified), sensitivity, specificity and positive predictive value will often be of general interest.
estat classification // classification matrixRunning /Users/agrogan/Desktop/GitHub/newstuff/categorical/classification/profile.do
> ...
Logistic model for low
-------- True --------
Classified | D ~D | Total
-----------+--------------------------+-----------
+ | 21 12 | 33
- | 38 118 | 156
-----------+--------------------------+-----------
Total | 59 130 | 189
Classified + if predicted Pr(D) >= .5
True D defined as low != 0
--------------------------------------------------
Sensitivity Pr( +| D) 35.59%
Specificity Pr( -|~D) 90.77%
Positive predictive value Pr( D| +) 63.64%
Negative predictive value Pr(~D| -) 75.64%
--------------------------------------------------
False + rate for true ~D Pr( +|~D) 9.23%
False - rate for true D Pr( -| D) 64.41%
False + rate for classified + Pr(~D| +) 36.36%
False - rate for classified - Pr( D| -) 24.36%
--------------------------------------------------
Correctly classified 73.54%
--------------------------------------------------“
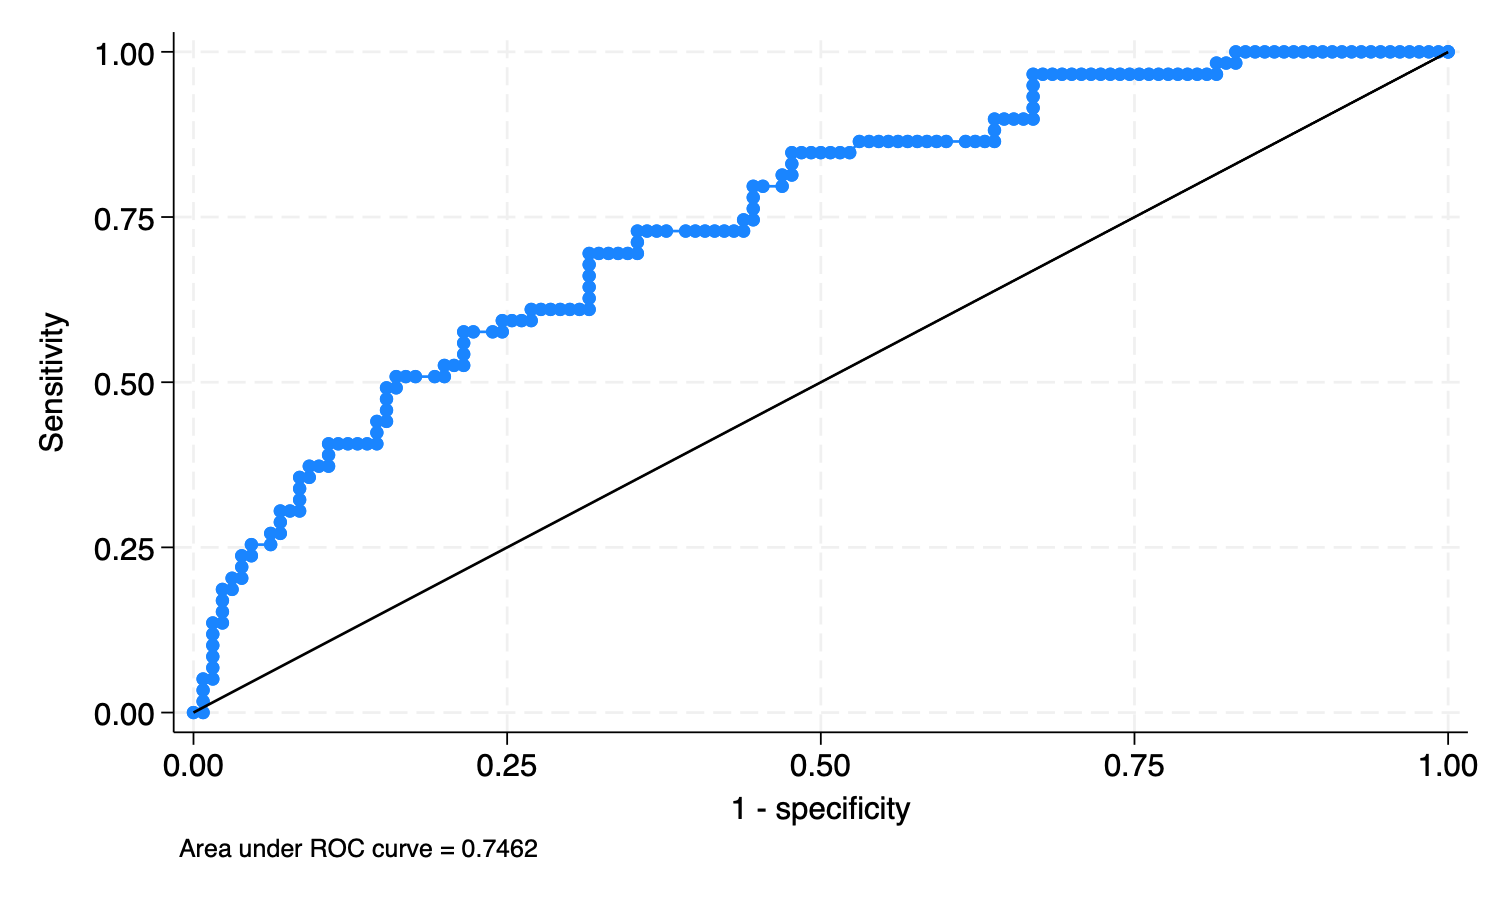
lrocgraphs the ROC curve—a graph of sensitivity versus one minus specificity as the cutoff c is varied—and calculates the area under it. Sensitivity is the fraction of observed positive-outcome cases that are correctly classified; specificity is the fraction of observed negative-outcome cases that are correctly classified. When the purpose of the analysis is classification, you must choose a cutoff.” (StataCorp, 2025)
“The curve starts at (0, 0), corresponding to c = 1, and continues to (1, 1), corresponding to c = 0. A model with no predictive power would be a \(45^{\circ}\) line. The greater the predictive power, the more bowed the curve, and hence the area beneath the curve is often used as a measure of the predictive power. A model with no predictive power has area 0.5; a perfect model has area 1.” (StataCorp, 2025)
lroc // ROC curve

graph export "ROC.png", width(1500) replace
Running /Users/agrogan/Desktop/GitHub/newstuff/categorical/classification/profile.do
> ...
Logistic model for low
Number of observations = 189
Area under ROC curve = 0.7462
file /Users/agrogan/Desktop/GitHub/newstuff/categorical/classification/ROC.png
saved as PNG format