Flipping Two Coins


Andy Grogan-Kaylor
Andy Grogan-Kaylor
9 Sep 2023
tabulate x y, row col chi2

Good value labels are key here.
. graph export unhelpfulgraph.png, width(500) replace
file
    /Users/agrogan/Desktop/GitHub/newstuff/categorical/contingency-tables/unhelpfulgraph.p
    > ng saved as PNG format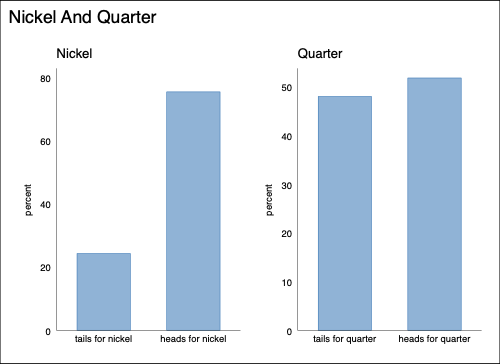
. tabulate nickel quarter, row col

┌───────────────────┐
│ Key               │
├───────────────────┤
│     frequency     │
│  row percentage   │
│ column percentage │
└───────────────────┘

                 │        quarter
          nickel │ tails for  heads for │     Total
─────────────────┼──────────────────────┼──────────
tails for nickel │       104        140 │       244
                 │     42.62      57.38 │    100.00
                 │     21.62      26.97 │     24.40
─────────────────┼──────────────────────┼──────────
heads for nickel │       377        379 │       756
                 │     49.87      50.13 │    100.00
                 │     78.38      73.03 │     75.60
─────────────────┼──────────────────────┼──────────
           Total │       481        519 │     1,000
                 │     48.10      51.90 │    100.00
│ 100.00 100.00 │ 100.00 . graph export nickel-quarter.png, width(500) replace
file
/Users/agrogan/Desktop/GitHub/newstuff/categorical/contingency-tables/nickel-quarter.p
> ng saved as PNG format
Does a bar chart work to visualize these relationships?
. graph export nickel-quarter-bar1.png, width(500) replace
file
    /Users/agrogan/Desktop/GitHub/newstuff/categorical/contingency-tables/nickel-quarter-b
    > ar1.png saved as PNG format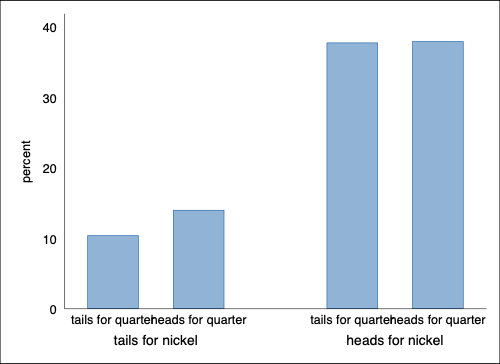
Option asyvars adds a crucial color element.
. graph export nickel-quarter-bar2.png, width(500) replace
file
    /Users/agrogan/Desktop/GitHub/newstuff/categorical/contingency-tables/nickel-quarter-b
    > ar2.png saved as PNG format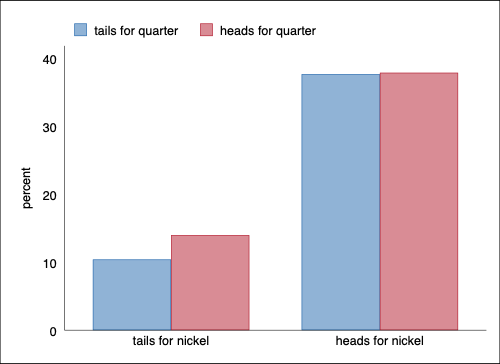
And hbar may improve legibility even more.
. graph export nickel-quarter-bar3.png, width(500) replace
file
    /Users/agrogan/Desktop/GitHub/newstuff/categorical/contingency-tables/nickel-quarter-b
    > ar3.png saved as PNG format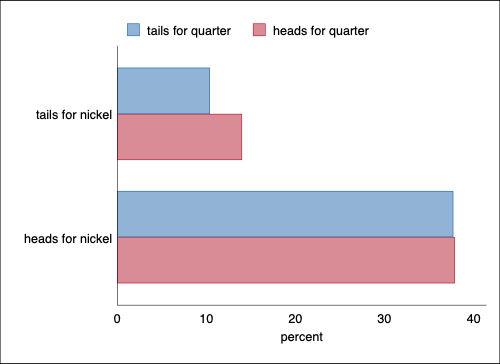
There are many alternative commands to do this, but the easiest way
is using edit.
I have already done this. Note the structure of the data is different from above.
. graph export FrenchSkiiers1.png, width(500) replace
file
    /Users/agrogan/Desktop/GitHub/newstuff/categorical/contingency-tables/FrenchSkiiers1.p
    > ng saved as PNG format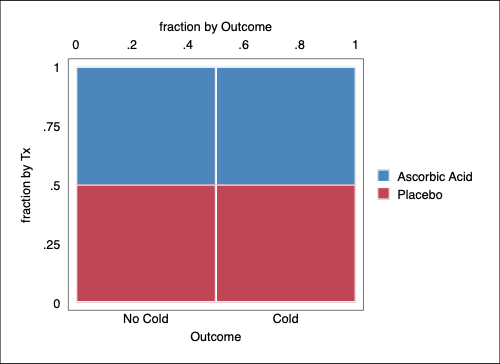
. graph export FrenchSkiiers2.png, width(500) replace
file
    /Users/agrogan/Desktop/GitHub/newstuff/categorical/contingency-tables/FrenchSkiiers2.p
    > ng saved as PNG format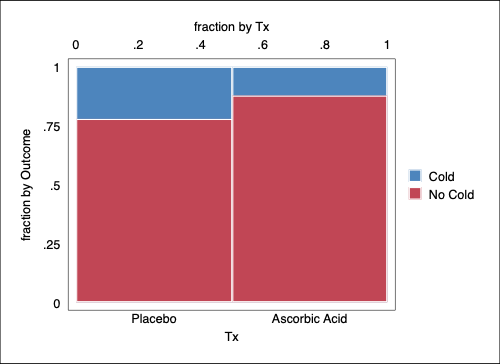
\(\begin{matrix} c_{ij} & c_{ij} & c_{i\bullet} \\ c_{ij} & c_{ij} & c_{i\bullet} \\ c_{\bullet j} & c_{\bullet j} & c_{\bullet \bullet} \\ \end{matrix}\)
\(\begin{matrix}p_{ij} & p_{ij} & p_{i\bullet} \\ p_{ij} & p_{ij} & p_{i \bullet} \\ p_{\bullet j} & p_{\bullet j} & p_{\bullet \bullet} \\ \end{matrix}\)
\(p_{ij}\) are joint probabilities.
\(p_{i \bullet}\) and \(p_{\bullet j}\) are marginal probabilities.
\(p_{ij} \mid p_{i \bullet}\) and \(p_{ij} \mid p_{\bullet j}\) are conditional probabilities.
\(\sum_{1}^{i} \sum_{1}^{j} c_{ij} = N\)
\(\sum_{1}^{i} \sum_{1}^{j} p_{ij} = 1.0\)
\(p_{ij} = p_{i \bullet} p_{\bullet j}\)
\(m_{ij} = \frac{m_{i \bullet} m_{\bullet j}}{m_{\bullet \bullet}}\)
Observed counts are represented by \(c\) while expected counts are represented by \(m\).
\[\text{conditional = joint / marginal}\]
. tabulate Tx Outcome [fweight = Count], cell row col

┌───────────────────┐
│ Key               │
├───────────────────┤
│     frequency     │
│  row percentage   │
│ column percentage │
│  cell percentage  │
└───────────────────┘

              │        Outcome
           Tx │   No Cold       Cold │     Total
──────────────┼──────────────────────┼──────────
      Placebo │       109         31 │       140
              │     77.86      22.14 │    100.00
              │     47.19      64.58 │     50.18
              │     39.07      11.11 │     50.18
──────────────┼──────────────────────┼──────────
Ascorbic Acid │       122         17 │       139
              │     87.77      12.23 │    100.00
              │     52.81      35.42 │     49.82
              │     43.73       6.09 │     49.82
──────────────┼──────────────────────┼──────────
        Total │       231         48 │       279
              │     82.80      17.20 │    100.00
              │    100.00     100.00 │    100.00
│ 82.80 17.20 │ 100.00 If independence is true, then joint probabilities = products of marginal probabilities.
That is, under independence, the conditional distribution equals the marginal distribution.
Under independence, row membership provides no information about the column distribution; and column membership provides no information about the row distribution.
Independence is a model, which is never exactly true in the real world.
\(\chi^2 = \Sigma \frac{(O-E)^2}{E}\)
. tabulate Tx Outcome [fweight = Count], row col chi2
┌───────────────────┐
│ Key │
├───────────────────┤
│ frequency │
│ row percentage │
│ column percentage │
└───────────────────┘
│ Outcome
Tx │ No Cold Cold │ Total
──────────────┼──────────────────────┼──────────
Placebo │ 109 31 │ 140
│ 77.86 22.14 │ 100.00
│ 47.19 64.58 │ 50.18
──────────────┼──────────────────────┼──────────
Ascorbic Acid │ 122 17 │ 139
│ 87.77 12.23 │ 100.00
│ 52.81 35.42 │ 49.82
──────────────┼──────────────────────┼──────────
Total │ 231 48 │ 279
│ 82.80 17.20 │ 100.00
│ 100.00 100.00 │ 100.00
Pearson chi2(1) = 4.8114 Pr = 0.028Following Viera, 2008:
\(\begin{bmatrix}a & b \\ c & d\end{bmatrix}\)
| Develop Outcome | Do Not Develop Outcome | |
|---|---|---|
| Exposed | a | b |
| Not Exposed | c | d |
\(R = \frac{a}{a+b}\) (in Exposed)
\(RR =\frac{\text{risk in exposed}}{\text{risk in not exposed}} = \frac{a/(a+b)}{c/(c+d)}\)
. tabulate Outcome Tx [fweight = Count]
│ Tx
Outcome │ Placebo Ascorbic │ Total
───────────┼──────────────────────┼──────────
No Cold │ 109 122 │ 231
Cold │ 31 17 │ 48
───────────┼──────────────────────┼──────────
Total │ 140 139 │ 279 . tabulate Outcome Tx [fweight = Count], col
┌───────────────────┐
│ Key │
├───────────────────┤
│ frequency │
│ column percentage │
└───────────────────┘
│ Tx
Outcome │ Placebo Ascorbic │ Total
───────────┼──────────────────────┼──────────
No Cold │ 109 122 │ 231
│ 77.86 87.77 │ 82.80
───────────┼──────────────────────┼──────────
Cold │ 31 17 │ 48
│ 22.14 12.23 │ 17.20
───────────┼──────────────────────┼──────────
Total │ 140 139 │ 279
│ 100.00 100.00 │ 100.00 . csi 17 31 122 109 // also has an intuitive dialog box
│ Exposed Unexposed │ Total
─────────────────┼────────────────────────┼───────────
Cases │ 17 31 │ 48
Noncases │ 122 109 │ 231
─────────────────┼────────────────────────┼───────────
Total │ 139 140 │ 279
│ │
Risk │ .1223022 .2214286 │ .172043
│ │
│ Point estimate │ [95% conf. interval]
├────────────────────────┼────────────────────────
Risk difference │ -.0991264 │ -.1868592 -.0113937
Risk ratio │ .5523323 │ .3209178 .9506203
Prev. frac. ex. │ .4476677 │ .0493797 .6790822
Prev. frac. pop │ .2230316 │
└────────────────────────┴────────────────────────
chi2(1) = 4.81 Pr>chi2 = 0.0283| Develop Outcome | Do Not Develop Outcome | |
|---|---|---|
| Exposed | a | b |
| Not Exposed | c | d |
\(OR =\)
\(\frac{\text{odds that exposed person develops outcome}}{\text{odds that unexposed person develops outcome}}\)
\(= \frac{\frac{a}{a+b} / \frac{b}{a+b}}{\frac{c}{c+d} / \frac{d}{c+d}} = \frac{a/b}{c/d} = \frac{ad}{bc}\)
In general for the 2 X 2 Table,
\(0 < OR < 1\)
indicates that one row is less likely to make the first response than the other row.
\(1 < OR < \infty\)
indicates that one row is more likely to make the first response than the other row.
. tabulate Tx Outcome [fweight = Count]

              │        Outcome
           Tx │   No Cold       Cold │     Total
──────────────┼──────────────────────┼──────────
      Placebo │       109         31 │       140
Ascorbic Acid │       122         17 │       139
──────────────┼──────────────────────┼──────────
        Total │       231         48 │       279
. csi 17 31 122 109, or // also has an intuitive dialog box
│ Exposed Unexposed │ Total
─────────────────┼────────────────────────┼───────────
Cases │ 17 31 │ 48
Noncases │ 122 109 │ 231
─────────────────┼────────────────────────┼───────────
Total │ 139 140 │ 279
│ │
Risk │ .1223022 .2214286 │ .172043
│ │
│ Point estimate │ [95% conf. interval]
├────────────────────────┼────────────────────────
Risk difference │ -.0991264 │ -.1868592 -.0113937
Risk ratio │ .5523323 │ .3209178 .9506203
Prev. frac. ex. │ .4476677 │ .0493797 .6790822
Prev. frac. pop │ .2230316 │
Odds ratio │ .4899524 │ .2588072 .9282861 (Cornfield)
└────────────────────────┴────────────────────────
chi2(1) = 4.81 Pr>chi2 = 0.0283