30 Jun 2021 09:14:56
DRAFT VERSION: COMMENTS, QUESTIONS AND CORRECTIONS WELCOME.
In another handout, we have discussed the idea that interactions in logistic regression models require careful interpretation. In this handout, we discuss the idea that, because logistic regression models are inherently non-linear–marginal change depends upon the value of the x’s–logistic regression models may have an interactive quality, even when no interaction is directly specified.
. use http://www.stata-press.com/data/r15/margex, clear // simulated data for margins
(Artificial data for margins)
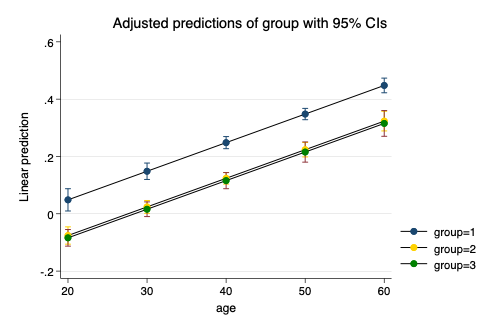
. regress outcome age i.group // linear model with only main effects, no interactions

      Source │       SS           df       MS      Number of obs   =     3,000
─────────────┼──────────────────────────────────   F(3, 2996)      =    208.92
       Model │  73.1197372         3  24.3732457   Prob > F        =    0.0000
    Residual │  349.519929     2,996  .116662193   R-squared       =    0.1730
─────────────┼──────────────────────────────────   Adj R-squared   =    0.1722
       Total │  422.639667     2,999  .140926865   Root MSE        =    .34156

─────────────┬────────────────────────────────────────────────────────────────
     outcome │ Coefficient  Std. err.      t    P>|t|     [95% conf. interval]
─────────────┼────────────────────────────────────────────────────────────────
         age │   .0099798    .000643    15.52   0.000     .0087191    .0112405
             │
       group │
          2  │  -.1244143   .0152899    -8.14   0.000    -.1543941   -.0944345
          3  │  -.1325247   .0193249    -6.86   0.000    -.1704162   -.0946332
             │
       _cons │  -.1509829   .0316164    -4.78   0.000    -.2129749   -.0889909
─────────────┴────────────────────────────────────────────────────────────────
. margins group, at(age = (20(10)60)) // calculate margins

Adjusted predictions                                     Number of obs = 3,000
Model VCE: OLS

Expression: Linear prediction, predict()
1._at: age = 20
2._at: age = 30
3._at: age = 40
4._at: age = 50
5._at: age = 60

─────────────┬────────────────────────────────────────────────────────────────
             │            Delta-method
             │     Margin   std. err.      t    P>|t|     [95% conf. interval]
─────────────┼────────────────────────────────────────────────────────────────
   _at#group │
        1 1  │   .0486131   .0198096     2.45   0.014     .0097713    .0874549
        1 2  │  -.0758012   .0153896    -4.93   0.000    -.1059765   -.0456258
        1 3  │  -.0839116   .0147861    -5.68   0.000    -.1129036   -.0549196
        2 1  │   .1484111   .0145895    10.17   0.000     .1198048    .1770175
        2 2  │   .0239968    .011409     2.10   0.036     .0016266    .0463671
        2 3  │   .0158864   .0130784     1.21   0.225    -.0097571      .04153
        3 1  │   .2482091   .0107686    23.05   0.000     .2270946    .2693236
        3 2  │   .1237948   .0103038    12.01   0.000     .1035917     .143998
        3 3  │   .1156844   .0143575     8.06   0.000     .0875329    .1438359
        4 1  │   .3480071   .0100871    34.50   0.000     .3282287    .3677855
        4 2  │   .2235928   .0128393    17.41   0.000      .198418    .2487677
        4 3  │   .2154824   .0179975    11.97   0.000     .1801938    .2507711
        5 1  │   .4478051   .0130467    34.32   0.000     .4222237    .4733865
        5 2  │   .3233908   .0174988    18.48   0.000     .2890799    .3577017
        5 3  │   .3152804   .0228989    13.77   0.000     .2703813    .3601795
─────────────┴────────────────────────────────────────────────────────────────
. marginsplot, scheme(michigan) // marginsplot

Variables that uniquely identify margins: age group
. graph export mymarginplot1.png, width(500) replace
file /Users/agrogan/Desktop/newstuff/categorical/logistic-inherently-interactive/mymarginplot1.png
    saved as PNG format
We see that, in accordance with the model that has no interactions, there are parallel regression lines for the different groups.
. logit outcome age i.group // logistic model with only main effects, no interactions

Iteration 0:   log likelihood = -1366.0718
Iteration 1:   log likelihood = -1117.4597
Iteration 2:   log likelihood = -1076.5953
Iteration 3:   log likelihood = -1075.0192
Iteration 4:   log likelihood = -1075.0132
Iteration 5:   log likelihood = -1075.0132

Logistic regression                                     Number of obs =  3,000
                                                        LR chi2(3)    = 582.12
                                                        Prob > chi2   = 0.0000
Log likelihood = -1075.0132                             Pseudo R2     = 0.2131

─────────────┬────────────────────────────────────────────────────────────────
     outcome │ Coefficient  Std. err.      z    P>|z|     [95% conf. interval]
─────────────┼────────────────────────────────────────────────────────────────
         age │   .0904989    .006473    13.98   0.000     .0778121    .1031857
             │
       group │
          2  │  -.7701431   .1262704    -6.10   0.000    -1.017629   -.5226576
          3  │  -1.723107   .2740705    -6.29   0.000    -2.260275   -1.185938
             │
       _cons │  -5.150287   .3293441   -15.64   0.000     -5.79579   -4.504784
─────────────┴────────────────────────────────────────────────────────────────
. margins group, at(age = (20(10)60)) // calculate margins

Adjusted predictions                                     Number of obs = 3,000
Model VCE: OIM

Expression: Pr(outcome), predict()
1._at: age = 20
2._at: age = 30
3._at: age = 40
4._at: age = 50
5._at: age = 60

─────────────┬────────────────────────────────────────────────────────────────
             │            Delta-method
             │     Margin   std. err.      z    P>|z|     [95% conf. interval]
─────────────┼────────────────────────────────────────────────────────────────
   _at#group │
        1 1  │   .0342139   .0067462     5.07   0.000     .0209916    .0474362
        1 2  │   .0161357   .0030183     5.35   0.000     .0102199    .0220515
        1 3  │   .0062842   .0017771     3.54   0.000     .0028011    .0097672
        2 1  │   .0805187   .0106928     7.53   0.000     .0595612    .1014761
        2 2  │   .0389606   .0052426     7.43   0.000     .0286854    .0492359
        2 3  │   .0153915   .0039878     3.86   0.000     .0075756    .0232074
        3 1  │   .1779452     .01342    13.26   0.000     .1516424    .2042479
        3 2  │   .0910836   .0088552    10.29   0.000     .0737278    .1084394
        3 3  │   .0372035   .0091939     4.05   0.000     .0191838    .0552233
        4 1  │   .3485673   .0149823    23.27   0.000     .3192025     .377932
        4 2  │   .1985334   .0171799    11.56   0.000     .1648614    .2322054
        4 3  │   .0871891   .0211918     4.11   0.000     .0456539    .1287243
        5 1  │   .5694594   .0228297    24.94   0.000     .5247141    .6142047
        5 2  │   .3797765    .033522    11.33   0.000     .3140745    .4454784
        5 3  │     .19101   .0448654     4.26   0.000     .1030754    .2789447
─────────────┴────────────────────────────────────────────────────────────────
. marginsplot, scheme(michigan) // marginsplot

Variables that uniquely identify margins: age group
. graph export mymarginplot2.png, width(500) replace
file /Users/agrogan/Desktop/newstuff/categorical/logistic-inherently-interactive/mymarginplot2.png
    saved as PNG format
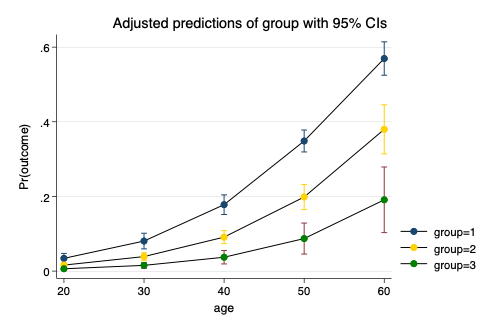
We see that, despite with the model that has no interactions, there are non-parallel (and non-linear) regression lines for the different groups.