The Stata Interface

The Stata Interface
Andy Grogan-Kaylor
Andy Grogan-Kaylor
2 Sep 2021
do_something to_variable(s), options
Quite often the default options are so well chosen that you do not need to specify any options.
use mydata.dtasummarize // descriptive statisticskeep x1 x2 x3 // keep only selected variableslist x1 x2 x3 in 1/10 // list cases for selected variablesbrowse // look at datalookfor [word] // look for variables with a particular word
The Stata Interface
. summarize

    Variable │        Obs        Mean    Std. dev.       Min        Max
─────────────┼─────────────────────────────────────────────────────────
          ID │        521    2965.449     1158.32       1005       4989
         age │        521     28.0438    7.047373   18.05584   45.45653
      gender │        521    1.821497    .7549825          1          3
     program │        521    2.197697    .7973963          1          4
mental_hea~1 │        521    95.11707    5.161698   80.93709   108.5736
─────────────┼─────────────────────────────────────────────────────────
mental_hea~2 │        521    98.87066    7.423767   79.57518   118.2272
    latitude │        521    42.25321    .1027698   41.99847    42.6237
   longitude │        521   -83.74921    .0987047  -84.04328  -83.42666
. summarize age, detail
age
─────────────────────────────────────────────────────────────
Percentiles Smallest
1% 18.17739 18.05584
5% 18.72159 18.05992
10% 19.54324 18.10945 Obs 521
25% 22.37428 18.13374 Sum of wgt. 521
50% 26.61352 Mean 28.0438
Largest Std. dev. 7.047373
75% 32.88188 44.35607
90% 38.46387 44.78399 Variance 49.66547
95% 41.26977 45.30344 Skewness .5501433
99% 44.16425 45.45653 Kurtosis 2.317297Some programs, e.g. R make you search for standard deviation. With Stata, sd is easily accessible with
summarize.
. graph export myhistogram.png, width(500) replace
file
    /Users/agrogan/Desktop/GitHub/newstuff/categorical/review-stats-intro-stata/myhistogram.
    > png saved as PNG format
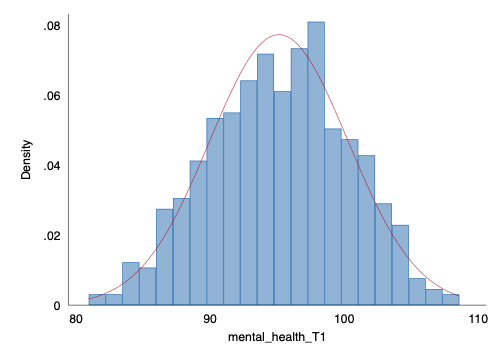
histogram of mental health
. graph export myscatter.png, width(500) replace
file
    /Users/agrogan/Desktop/GitHub/newstuff/categorical/review-stats-intro-stata/myscatter.pn
    > g saved as PNG format
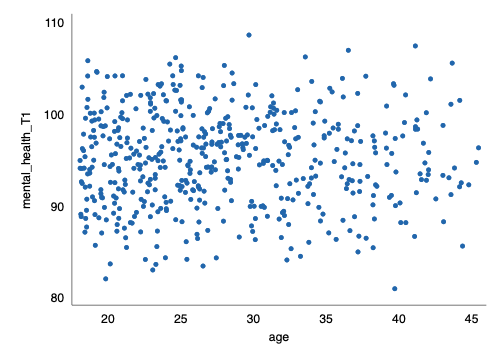
scatterplot of age and mental health
. graph export mybargraph.png, width(500) replace
file
    /Users/agrogan/Desktop/GitHub/newstuff/categorical/review-stats-intro-stata/mybargraph.p
    > ng saved as PNG format
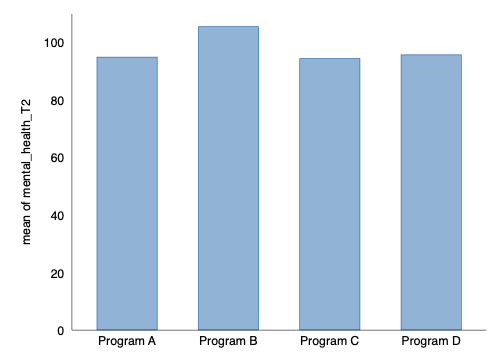
bar graph of mental health at time 2
. ttest mental_health_T2, by(program)

Two-sample t test with equal variances
─────────┬────────────────────────────────────────────────────────────────────
   Group │     Obs        Mean    Std. err.   Std. dev.   [95% conf. interval]
─────────┼────────────────────────────────────────────────────────────────────
 Program │     111     94.7963    .4969934     5.23615    93.81138    95.78123
 Program │     209    105.3512    .3562424    5.150136    104.6489    106.0535
─────────┼────────────────────────────────────────────────────────────────────
Combined │     320      101.69    .4033737    7.215767    100.8964    102.4836
─────────┼────────────────────────────────────────────────────────────────────
    diff │           -10.55491    .6083793               -11.75187   -9.357953
─────────┴────────────────────────────────────────────────────────────────────
    diff = mean(Program) - mean(Program)                          t = -17.3492
H0: diff = 0                                     Degrees of freedom =      318

    Ha: diff < 0                 Ha: diff != 0                 Ha: diff > 0
Pr(T < t) = 0.0000 Pr(|T| > |t|) = 0.0000 Pr(T > t) = 1.0000. oneway mental_health_T2 program, tabulate // oneway analysis of variance
│ Summary of mental_health_T2
program │ Mean Std. dev. Freq.
────────────┼────────────────────────────────────
Program A │ 94.796305 5.2361502 111
Program B │ 105.35121 5.1501362 209
Program C │ 94.299149 5.2002254 188
Program D │ 95.582917 5.6199143 13
────────────┼────────────────────────────────────
Total │ 98.870656 7.4237673 521
Analysis of variance
Source SS df MS F Prob > F
────────────────────────────────────────────────────────────────────────
Between groups 14689.6155 3 4896.53849 181.23 0.0000
Within groups 13968.791 517 27.0189382
────────────────────────────────────────────────────────────────────────
Total 28658.4065 520 55.1123202
Bartlett's equal-variances test: chi2(3) = 0.1991 Prob>chi2 = 0.978Importantly,
,tabulategives us a table of results.
. regress mental_health_T2 mental_health_T1 i.program

      Source │       SS           df       MS      Number of obs   =       521
─────────────┼──────────────────────────────────   F(4, 516)       =    135.94
       Model │  14704.3725         4  3676.09313   Prob > F        =    0.0000
    Residual │   13954.034       516  27.0427015   R-squared       =    0.5131
─────────────┼──────────────────────────────────   Adj R-squared   =    0.5093
       Total │  28658.4065       520  55.1123202   Root MSE        =    5.2003

─────────────────┬────────────────────────────────────────────────────────────────
mental_health_T2 │ Coefficient  Std. err.      t    P>|t|     [95% conf. interval]
─────────────────┼────────────────────────────────────────────────────────────────
mental_health_T1 │  -.0327405    .044321    -0.74   0.460    -.1198123    .0543314
                 │
         program │
      Program B  │   10.57171   .6111758    17.30   0.000     9.371008    11.77241
      Program C  │   -.494409   .6224837    -0.79   0.427    -1.717323     .728505
      Program D  │   .7226213   1.526873     0.47   0.636     -2.27703    3.722272
                 │
           _cons │   97.90435   4.236239    23.11   0.000     89.58195    106.2267
─────────────────┴────────────────────────────────────────────────────────────────Instructor will draw this out.
. regress mental_health_T2 c.mental_health_T1##i.program

      Source │       SS           df       MS      Number of obs   =       521
─────────────┼──────────────────────────────────   F(7, 513)       =     77.65
       Model │  14743.6327         7  2106.23324   Prob > F        =    0.0000
    Residual │  13914.7738       513  27.1243155   R-squared       =    0.5145
─────────────┼──────────────────────────────────   Adj R-squared   =    0.5078
       Total │  28658.4065       520  55.1123202   Root MSE        =    5.2081

───────────────────────────┬────────────────────────────────────────────────────────────────
          mental_health_T2 │ Coefficient  Std. err.      t    P>|t|     [95% conf. interval]
───────────────────────────┼────────────────────────────────────────────────────────────────
          mental_health_T1 │   .0038108   .0940124     0.04   0.968    -.1808858    .1885074
                           │
                   program │
                Program B  │   14.13882   11.07298     1.28   0.202    -7.615155    35.89279
                Program C  │   2.227825    11.6862     0.19   0.849    -20.73087    25.18653
                Program D  │   27.30439    22.3002     1.22   0.221    -16.50657    71.11535
                           │
program#c.mental_health_T1 │
                Program B  │  -.0375708   .1162481    -0.32   0.747    -.2659517    .1908101
                Program C  │  -.0286832   .1228833    -0.23   0.816    -.2700997    .2127332
                Program D  │  -.2851331   .2385022    -1.20   0.232    -.7536944    .1834281
                           │
                     _cons │   94.43455   8.938253    10.57   0.000     76.87446    111.9946
───────────────────────────┴────────────────────────────────────────────────────────────────
Social Service Agency Data