Simulation of Simpson’s Paradox With Hospital Data

Author

Andy Grogan-Kaylor

Published

July 10, 2025

1 Background

Simpson’s paradox occurs when a bivariate association is reversed in a multivariate model. This example uses simulated data from hospitals (Wang et al., 2018).

2 Setup

Show the code

clear all

use "hospitaldata.dta", clear
    
list
     | hospital      severity   outcome   count |
     |------------------------------------------|
  1. |   better   less severe   success      18 |
  2. |   better   less severe   failure       2 |
  3. |   better   more severe   success      32 |
  4. |   better   more severe   failure      48 |
  5. |   normal   less severe   success      64 |
     |------------------------------------------|
  6. |   normal   less severe   failure      16 |
  7. |   normal   more severe   success       4 |
  8. |   normal   more severe   failure      16 |
     +------------------------------------------+

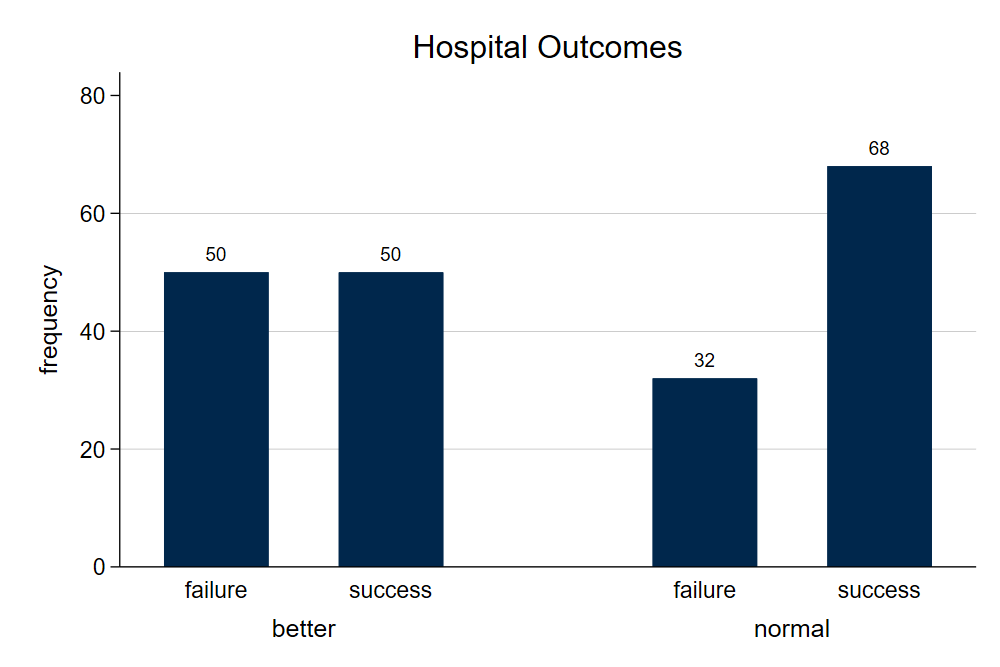
3 Outcome By Hospital Type

It appears as though patients do better at the normal hospital, as opposed to the better hospital.

Show the code
    
tabulate hospital outcome [fweight = count], row 
    
graph bar (count) [fweight = count], over(outcome) over(hospital) blabel(bar) title("Hospital Outcomes") scheme(michigan)
        
quietly: graph export bivariategraph.png, width(2000) replace
| Key            |
|----------------|
|   frequency    |
| row percentage |
+----------------+

           |        outcome
  hospital |   failure    success |     Total
-----------+----------------------+----------
    better |        50         50 |       100 
           |     50.00      50.00 |    100.00 
-----------+----------------------+----------
    normal |        32         68 |       100 
           |     32.00      68.00 |    100.00 
-----------+----------------------+----------
     Total |        82        118 |       200 
           |     41.00      59.00 |    100.00 

Bivariate Relationships

Bivariate Relationships

4 Outcome By Hospital Type by Severity

When we factor in the severity of the illness, we arrive at the reverse conclusion. Patients do better at the better hospital.

Show the code

generate severity_hospital = severity + " " + hospital // concatenate severity + hospital type

tabulate severity_hospital outcome [fweight=count], row 
    
graph bar [fweight = count] if severity == "less severe", ///
title(Less Severe) ///
over(outcome) ///
blabel(bar) ///
by(hospital) ////
scheme(michigan) ///
name(lesssevere, replace)
    
graph bar [fweight = count] if severity == "more severe", ///
title(More Severe) ///
over(outcome) ///
blabel(bar) ///
by(hospital) ///
scheme(michigan) ///
name(moresevere, replace)
    
graph combine lesssevere moresevere, title(Hospital Outcomes) scheme(michigan)

quietly: graph export multivariategraph.png, width(2000) replace
| Key            |
|----------------|
|   frequency    |
| row percentage |
+----------------+

                   |        outcome
 severity_hospital |   failure    success |     Total
-------------------+----------------------+----------
less severe better |         2         18 |        20 
                   |     10.00      90.00 |    100.00 
-------------------+----------------------+----------
less severe normal |        16         64 |        80 
                   |     20.00      80.00 |    100.00 
-------------------+----------------------+----------
more severe better |        48         32 |        80 
                   |     60.00      40.00 |    100.00 
-------------------+----------------------+----------
more severe normal |        16          4 |        20 
                   |     80.00      20.00 |    100.00 
-------------------+----------------------+----------
             Total |        82        118 |       200 
                   |     41.00      59.00 |    100.00 

Multivariate Relationships

Multivariate Relationships

5 Reference

Wang, B., Wu, P., Kwan, B., Tu, X. M., & Feng, C. (2018). Simpson’s Paradox: Examples. Shanghai Archives of Psychiatry, 30(2), 139–143. https://doi.org/10.11919/j.issn.1002-0829.218026