Show the code
library(ggplot2) # graphics

library(patchwork) # graphics

library(dplyr) # data wrangling

library(sjPlot) # nice tables

set.seed(1234) # set random seedSelecting on a collider may introduce bias.
library(ggplot2) # graphics
library(patchwork) # graphics
library(dplyr) # data wrangling
library(sjPlot) # nice tables
set.seed(1234) # set random seedN <- 1000 # sample size
x <- rnorm(N, 100, 10) # randomly distributed x
e <- rnorm(N, 0, 5) # normal error
y <- 1 * x + e # y is a function of x + random error (e)
df <- data.frame(x, y) # data frame
head(df) # replay x y
1 87.92934 81.90268
2 102.77429 104.28163
3 110.84441 103.14869
4 76.54302 79.71988
5 104.29125 107.80601
6 105.06056 95.53114We generate a collider: \(z = x + y\) and then select observations if \(z > 215\) (an admittedly arbitrary, but illustrative value).
df$z <- df$x + df$y # z is a collider

df$selected <- df$z > 215

df_selected <- df %>% # data selected on collider
filter(selected) # selection criterionWe graph the data to get an idea of the full dataset, with selected and non-selected observations, as well as a graph of the selected data only.
We note that relationships, as typified by the regression line, are quite different in the overall and non-selected data.
p1 <- ggplot(df,
             aes(x = x,
                 y = y)) +
  geom_point(aes(color = selected)) +
  geom_smooth(method = "lm") +
  labs(title = "y ~ x",
       subtitle = "Entire Sample") +
  scale_color_manual(values = c('TRUE' = 'blue',
                                'FALSE' = 'red')) +
  ylim(50, 150) + # specify y scale
theme_minimal()p2 <- ggplot(df_selected,
aes(x = x,
y = y)) +
geom_point(aes(color = selected)) +
geom_smooth(method = "lm") +
labs(title = "y ~ x",
subtitle = "Selected On Collider") +
scale_color_manual(values = c('TRUE' = 'blue',
'FALSE' = 'red')) +
ylim(50, 150) + # specify y scale
theme_minimal()p1 + p2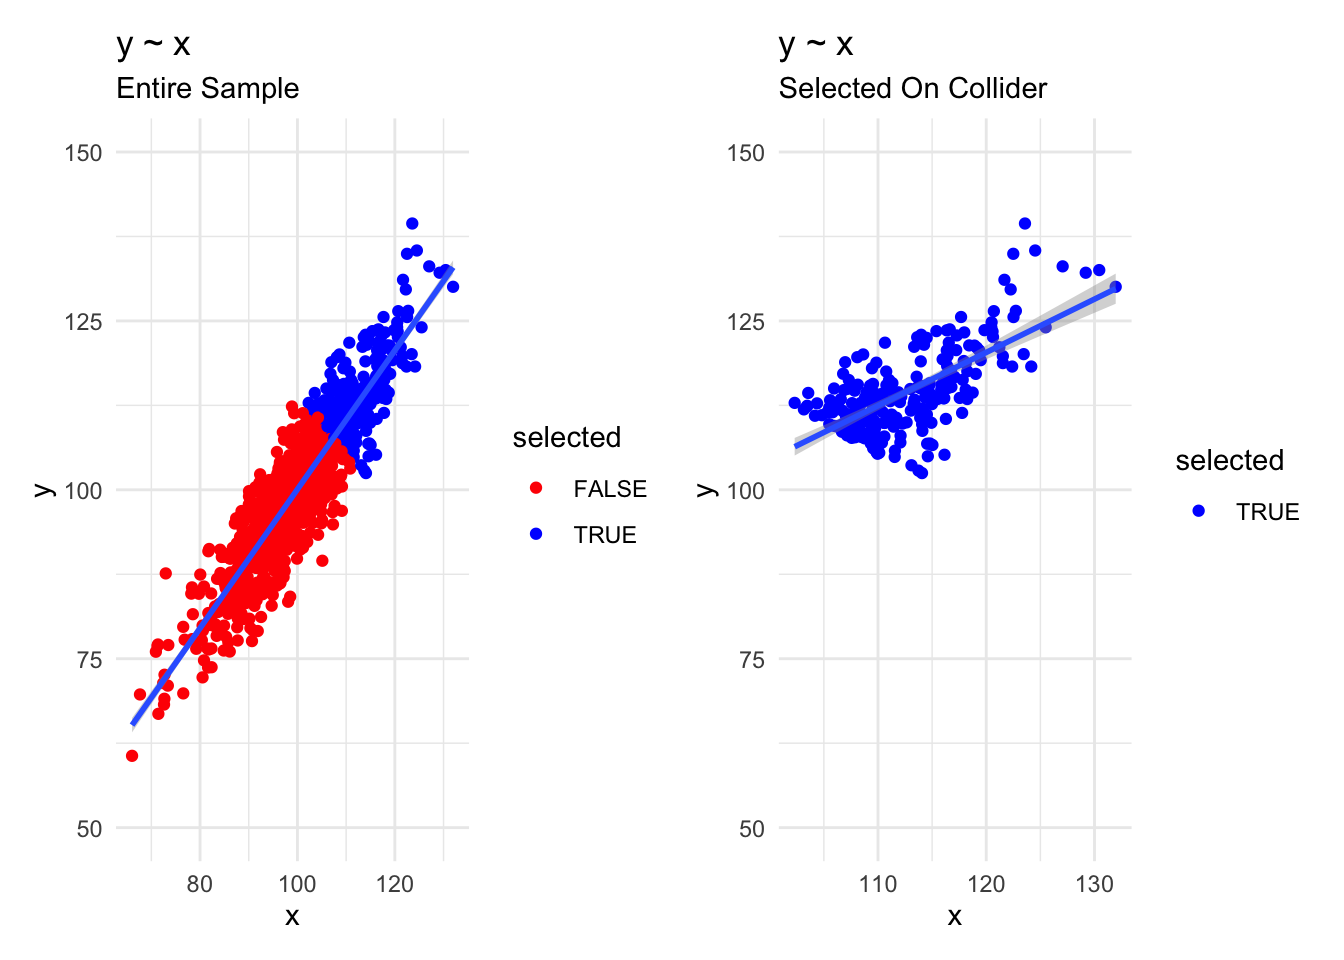
Similarly, regressions find quite different coefficients for x in the two datasets.
fit1 <- lm(y ~ x, data = df)

fit2 <- lm(y ~ x, data = df_selected)

tab_model(fit1, fit2,
dv.labels = c("Entire Sample", "Selected on Collider"))| Entire Sample | Selected on Collider | |||||
| Predictors | Estimates | CI | p | Estimates | CI | p |
| (Intercept) | -2.71 | -5.76 – 0.35 | 0.083 | 25.68 | 13.09 – 38.27 | <0.001 |
| x | 1.03 | 1.00 – 1.06 | <0.001 | 0.79 | 0.68 – 0.90 | <0.001 |
| Observations | 1000 | 228 | ||||
| R2 / R2 adjusted | 0.814 / 0.814 | 0.462 / 0.460 | ||||