Code
library(pander) # nice tables

library(rgl) # 3D graphics

library(car) # companion to applied regressionlibrary(pander) # nice tables
library(rgl) # 3D graphics
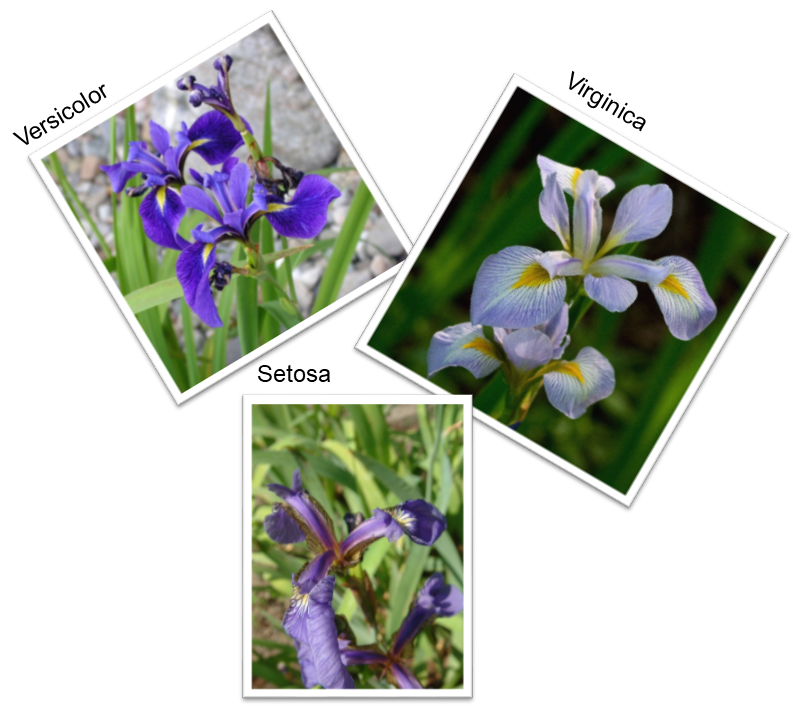
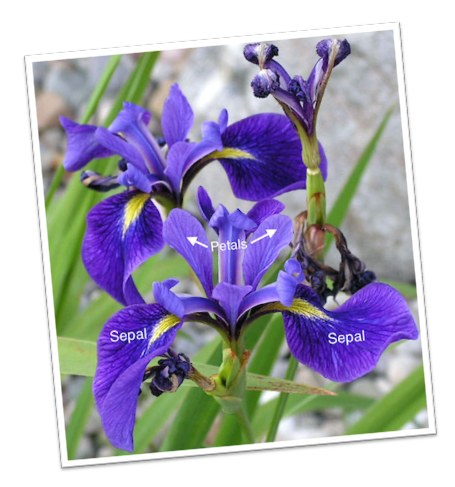
library(car) # companion to applied regressionThese are the famous Iris data, collected by Edgar Anderson.
data("iris") # iris data

pander(head(iris)) # nice table of top of data| Sepal.Length | Sepal.Width | Petal.Length | Petal.Width | Species |
|---|---|---|---|---|
| 5.1 | 3.5 | 1.4 | 0.2 | setosa |
| 4.9 | 3 | 1.4 | 0.2 | setosa |
| 4.7 | 3.2 | 1.3 | 0.2 | setosa |
| 4.6 | 3.1 | 1.5 | 0.2 | setosa |
| 5 | 3.6 | 1.4 | 0.2 | setosa |
| 5.4 | 3.9 | 1.7 | 0.4 | setosa |
fit1 <- lm(Petal.Length ~ Sepal.Length + Sepal.Width, data = iris)

pander(fit1) # nice table| Estimate | Std. Error | t value | Pr(>|t|) | |
|---|---|---|---|---|
| (Intercept) | -2.525 | 0.5634 | -4.481 | 1.484e-05 |
| Sepal.Length | 1.776 | 0.06441 | 27.57 | 5.848e-60 |
| Sepal.Width | -1.339 | 0.1224 | -10.94 | 9.429e-21 |
options(rgl.useNULL = TRUE) # suppress separate RGL window.

car::scatter3d(x = iris$Sepal.Length,
               y = iris$Petal.Length,
               z = iris$Sepal.Width,
               xlab = "Sepal Length",
               ylab = "Petal Length",
               zlab = "Sepal Width")

rglwidget()