2 Feb 2022 11:46:25
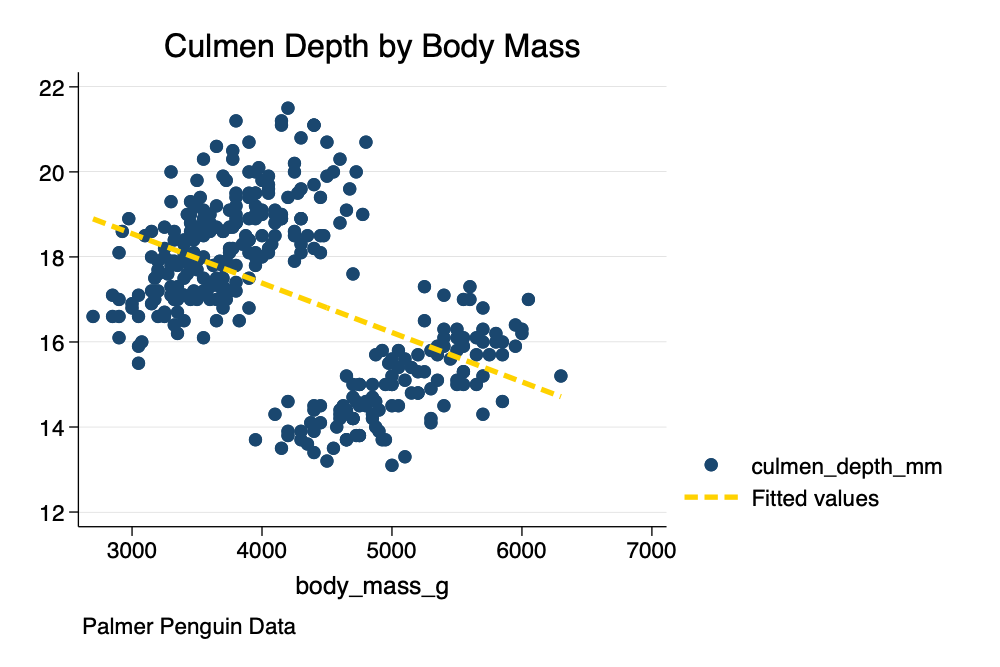
Simpson’s paradox occurs when a bivariate association is reversed in a multivariate model. This example using the Palmer Penguins Data was inspired by a tweet by Andrew Heiss.

To begin, a little definition of penguin terminology is in order. Note the diagram defining culmen depth below.

. clear all
. use "penguins.dta"
. twoway (scatter culmen_depth_mm body_mass_g) ///
> (lfit culmen_depth_mm body_mass_g), ///
> title("Culmen Depth by Body Mass") ///
> caption("Palmer Penguin Data") ///
> scheme(michigan)
. graph export mygraph1.png, width(1000) replace
file /Users/agrogan/Desktop/GitHub/teaching/simpsons-paradox-palmer-penguins/mygraph1.png saved
    as PNG format

. regress culmen_depth_mm body_mass_g

      Source │       SS           df       MS      Number of obs   =       342
─────────────┼──────────────────────────────────   F(1, 340)       =     97.41
       Model │   296.15994         1   296.15994   Prob > F        =    0.0000
    Residual │  1033.67459       340  3.04021939   R-squared       =    0.2227
─────────────┼──────────────────────────────────   Adj R-squared   =    0.2204
       Total │  1329.83453       341  3.89980801   Root MSE        =    1.7436

─────────────┬────────────────────────────────────────────────────────────────
culmen_dep~m │ Coefficient  Std. err.      t    P>|t|     [95% conf. interval]
─────────────┼────────────────────────────────────────────────────────────────
 body_mass_g │  -.0011621   .0001177    -9.87   0.000    -.0013937   -.0009305
       _cons │   22.03395   .5036206    43.75   0.000     21.04334    23.02455
─────────────┴────────────────────────────────────────────────────────────────
. est store M1
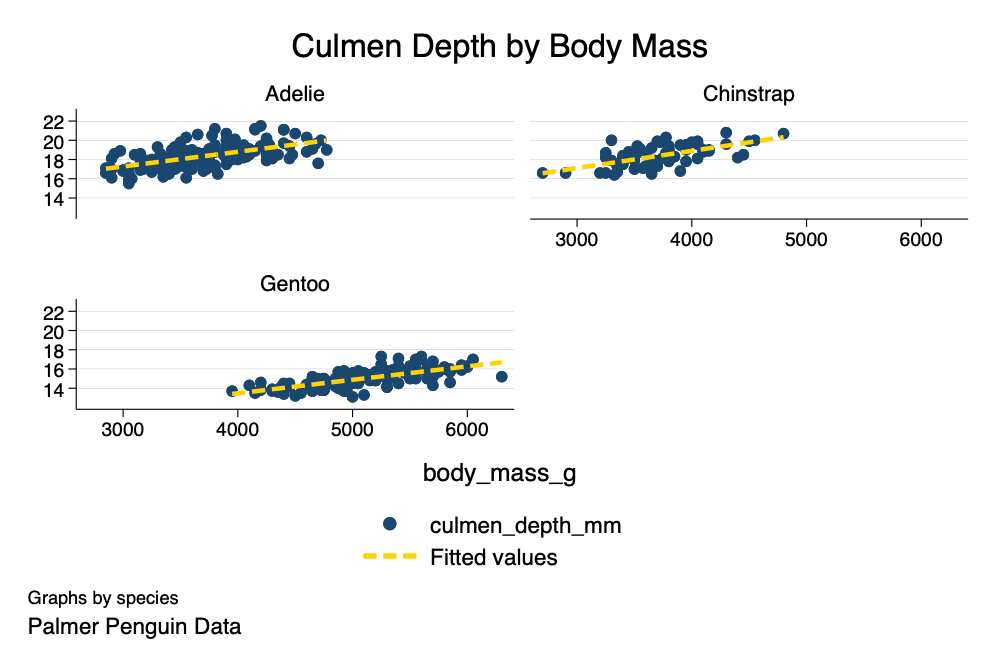
. twoway (scatter culmen_depth_mm body_mass_g) ///
> (lfit culmen_depth_mm body_mass_g), ///
> by(species, title("Culmen Depth by Body Mass") caption("Palmer Penguin Data")) ///
> scheme(michigan)
. graph export mygraph2.png, width(1000) replace
file /Users/agrogan/Desktop/GitHub/teaching/simpsons-paradox-palmer-penguins/mygraph2.png saved
    as PNG format
The association is reversed when we take into account multiple variables.

. regress culmen_depth_mm body_mass_g species

      Source │       SS           df       MS      Number of obs   =       342
─────────────┼──────────────────────────────────   F(2, 339)       =    225.41
       Model │  759.047284         2  379.523642   Prob > F        =    0.0000
    Residual │  570.787248       339   1.6837382   R-squared       =    0.5708
─────────────┼──────────────────────────────────   Adj R-squared   =    0.5683
       Total │  1329.83453       341  3.89980801   Root MSE        =    1.2976

─────────────┬────────────────────────────────────────────────────────────────
culmen_dep~m │ Coefficient  Std. err.      t    P>|t|     [95% conf. interval]
─────────────┼────────────────────────────────────────────────────────────────
 body_mass_g │   .0004877   .0001326     3.68   0.000     .0002269    .0007485
     species │  -1.974985   .1191142   -16.58   0.000    -2.209281   -1.740689
       _cons │   18.89014   .4200224    44.97   0.000     18.06396    19.71631
─────────────┴────────────────────────────────────────────────────────────────
. est store M2
. est table M1 M2, b(%7.4f) star

─────────────┬──────────────────────────
    Variable │     M1           M2
─────────────┼──────────────────────────
 body_mass_g │ -0.0012***    0.0005***
     species │              -1.9750***
       _cons │ 22.0339***   18.8901***
─────────────┴──────────────────────────
Legend: * p<0.05; ** p<0.01; *** p<0.001