teaching

teaching stuff
Simulated Data From Social Service Agency

Simulated data for use in classes on Program Evaluation, Research Methods, Statistics and Data Visualization.
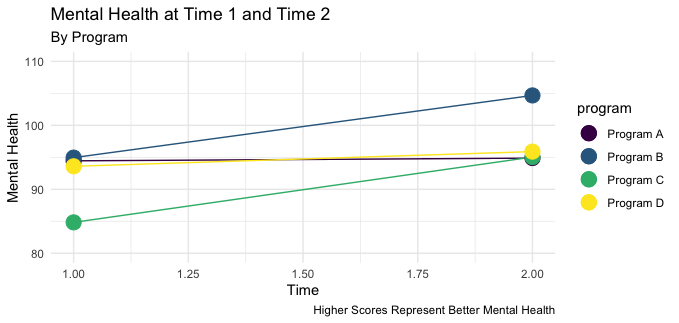
The data contain the following (simulated) variables: “ID”, “age”, “gender”, “race_ethnicity”, “family_income”, “program”, “mental_health_T1”, “mental_health_T2”, “latitude”, “longitude”.
The mental health variables are scaled to have an average of 100. Lower numbers indicate lower mental health, while higher numbers indicate higher mental health.
There are some differences in mental health status in the data and an interesting exercise could be to use software like Excel, Google Sheets, Tableau or R to try to see which factors predict these differences.
Dataviz Exercise
Dataviz exercise with Simulated Social Service Agency data.
Dataset
The Excel formatted version of this data may be the most readily useful: https://agrogan1.github.io/teaching/social-service-agency/social-service-agency.xlsx. Alternatively, you may prefer the CSV version of the clients data: https://agrogan1.github.io/teaching/social-service-agency/clients.csv
The data can be used independently of the PDF handout and are free to use and share for other classes.
For example, you may wish to visualize these data using software like Excel, Google Sheets, or Tableau. See How To Choose A Chart: An Intuitive Guide
Data Explorer
Experimental Data Explorer