Andy Grogan-Kaylor
Andy Grogan-Kaylor
5 Oct 2020
Linear models, probit and logit
y x1 x2 ...
\(\leftarrow\) \(\rightarrow\) \(F(y) = \beta_0 + \beta x_1 + \beta x_2 ...\)
regress y x1 x2
OLS; Linear Model
logit y x1 x2
Logistic Regression
probit y x1 x2
Probit Regression
glm ...
. codebook polviews // what does this variable look like?
────────────────────────────────────────────────────────────────────────────────────────────
polviews think of self as liberal or conservative
────────────────────────────────────────────────────────────────────────────────────────────
type: numeric (byte)
label: POLVIEWS
range: [1,7] units: 1
unique values: 7 missing .: 0/64,814
unique mv codes: 3 missing .*: 9,486/64,814
tabulation: Freq. Numeric Label
1,682 1 extremely liberal
6,514 2 liberal
7,010 3 slightly liberal
21,370 4 moderate
8,690 5 slghtly conservative
8,230 6 conservative
1,832 7 extrmly conservative
2,326 .d DK
6,777 .i IAP
383 .n NA
. recode polviews (1/3 = 1)(4/7 = 0), generate(liberal) // dichotomize
(53646 differences between polviews and liberal)
. egen income_group = cut(coninc), group(3) // divide income into three groups
(6520 missing values generated)
Reference group for income group is 0
. recode hispanic (1 = 1)(else = 0), generate(latinx) // Latinx
(41258 differences between hispanic and latinx)
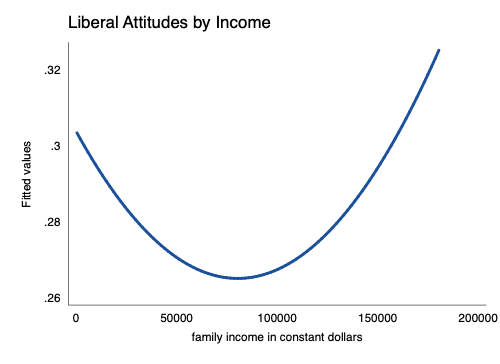
. graph export liberal-income.png, width(500) replace
(file liberal-income.png written in PNG format)
. regress liberal i.race i.income_group
Source │ SS df MS Number of obs = 50,191
─────────────┼────────────────────────────────── F(4, 50186) = 64.96
Model │ 52.1435055 4 13.0358764 Prob > F = 0.0000
Residual │ 10071.8678 50,186 .200690786 R-squared = 0.0052
─────────────┼────────────────────────────────── Adj R-squared = 0.0051
Total │ 10124.0113 50,190 .201713713 Root MSE = .44799
─────────────┬────────────────────────────────────────────────────────────────
liberal │ Coef. Std. Err. t P>|t| [95% Conf. Interval]
─────────────┼────────────────────────────────────────────────────────────────
race │
black │ .0857774 .0059616 14.39 0.000 .0740926 .0974621
other │ .064563 .008817 7.32 0.000 .0472816 .0818444
│
income_group │
1 │ -.0082847 .0049636 -1.67 0.095 -.0180134 .001444
2 │ -.0067437 .0049739 -1.36 0.175 -.0164925 .0030051
│
_cons │ .2701971 .0037985 71.13 0.000 .2627521 .2776422
─────────────┴────────────────────────────────────────────────────────────────
. probit liberal i.race i.latinx i.class i.income_group
Iteration 0: log likelihood = -28929.993
Iteration 1: log likelihood = -28779.708
Iteration 2: log likelihood = -28779.659
Iteration 3: log likelihood = -28779.659
Probit regression Number of obs = 48,767
LR chi2(8) = 300.67
Prob > chi2 = 0.0000
Log likelihood = -28779.659 Pseudo R2 = 0.0052
───────────────┬────────────────────────────────────────────────────────────────
liberal │ Coef. Std. Err. z P>|z| [95% Conf. Interval]
───────────────┼────────────────────────────────────────────────────────────────
race │
black │ .2556235 .0176569 14.48 0.000 .2210165 .2902305
other │ .1917797 .0263808 7.27 0.000 .1400744 .2434851
│
1.latinx │ -.0105591 .0128091 -0.82 0.410 -.0356644 .0145462
│
class │
working class │ -.0533243 .0268567 -1.99 0.047 -.1059624 -.0006861
middle class │ .0364691 .0275156 1.33 0.185 -.0174605 .0903987
upper class │ .1287644 .0426698 3.02 0.003 .0451331 .2123957
│
income_group │
1 │ -.0277126 .0153164 -1.81 0.070 -.0577322 .002307
2 │ -.0430226 .0159505 -2.70 0.007 -.074285 -.0117602
│
_cons │ -.597907 .0258768 -23.11 0.000 -.6486245 -.5471894
───────────────┴────────────────────────────────────────────────────────────────
. logit liberal i.race i.latinx i.class i.income_group
Iteration 0: log likelihood = -28929.993
Iteration 1: log likelihood = -28780.507
Iteration 2: log likelihood = -28779.998
Iteration 3: log likelihood = -28779.998
Logistic regression Number of obs = 48,767
LR chi2(8) = 299.99
Prob > chi2 = 0.0000
Log likelihood = -28779.998 Pseudo R2 = 0.0052
───────────────┬────────────────────────────────────────────────────────────────
liberal │ Coef. Std. Err. z P>|z| [95% Conf. Interval]
───────────────┼────────────────────────────────────────────────────────────────
race │
black │ .4224471 .0289399 14.60 0.000 .3657258 .4791683
other │ .3178327 .0433273 7.34 0.000 .2329127 .4027526
│
1.latinx │ -.018475 .0214155 -0.86 0.388 -.0604486 .0234985
│
class │
working class │ -.0889014 .0446312 -1.99 0.046 -.176377 -.0014258
middle class │ .0599663 .0456742 1.31 0.189 -.0295536 .1494862
upper class │ .2126988 .0704279 3.02 0.003 .0746626 .3507349
│
income_group │
1 │ -.0454226 .0255762 -1.78 0.076 -.095551 .0047057
2 │ -.0697336 .0266137 -2.62 0.009 -.1218954 -.0175718
│
_cons │ -.9703756 .0430156 -22.56 0.000 -1.054685 -.8860666
───────────────┴────────────────────────────────────────────────────────────────
NB: Negative vs. positive \(\beta\). Statistically significant vs. not statistically significant.
. est table myprobit mylogit, star
─────────────┬────────────────────────────────
Variable │ myprobit mylogit
─────────────┼────────────────────────────────
race │
black │ .25562351*** .42244708***
other │ .19177974*** .31783265***
│
latinx │
1 │ -.0105591 -.01847504
│
class │
working c.. │ -.05332425* -.08890139*
middle cl.. │ .03646909 .05996631
upper class │ .12876439** .21269875**
│
income_group │
1 │ -.02771262 -.04542261
2 │ -.04302264** -.06973358**
│
_cons │ -.59790698*** -.9703756***
─────────────┴────────────────────────────────
legend: * p<0.05; ** p<0.01; *** p<0.001
Derivation of logistic model from linear probability model. Using instructor notes
\[ \ln \left( \frac{P(y)}{1-P(y)} \right) = \beta_0 + \beta_1 x_1 + \beta_2 x_2 + ... \]
\[ 0 < OR < 1 \]
indicates that an increase in x is associated with a decrease in y.
\[ 1 < OR < \infty \]
indicates that an increase in x is associated with an increase in y.
. logit liberal i.race i.latinx i.class i.income_group, or
Iteration 0: log likelihood = -28929.993
Iteration 1: log likelihood = -28780.507
Iteration 2: log likelihood = -28779.998
Iteration 3: log likelihood = -28779.998
Logistic regression Number of obs = 48,767
LR chi2(8) = 299.99
Prob > chi2 = 0.0000
Log likelihood = -28779.998 Pseudo R2 = 0.0052
───────────────┬────────────────────────────────────────────────────────────────
liberal │ Odds Ratio Std. Err. z P>|z| [95% Conf. Interval]
───────────────┼────────────────────────────────────────────────────────────────
race │
black │ 1.52569 .0441534 14.60 0.000 1.44156 1.614731
other │ 1.374146 .059538 7.34 0.000 1.262271 1.495937
│
1.latinx │ .9816946 .0210234 -0.86 0.388 .9413422 1.023777
│
class │
working class │ .9149358 .0408347 -1.99 0.046 .8383019 .9985752
middle class │ 1.061801 .048497 1.31 0.189 .9708789 1.161237
upper class │ 1.237012 .0871201 3.02 0.003 1.077521 1.420111
│
income_group │
1 │ .9555936 .0244404 -1.78 0.076 .908872 1.004717
2 │ .9326423 .024821 -2.62 0.009 .885241 .9825817
│
_cons │ .3789407 .0163004 -22.56 0.000 .3483023 .4122742
───────────────┴────────────────────────────────────────────────────────────────
Note: _cons estimates baseline odds.
See handout
Discussion
See interactive demo, or example script.
https://agrogan1.github.io/newstuff/categorical/logistic-interactions-2/logistic-interactions-2.html