Code
options(scipen = 999) # turn off scientific notation

N <- 100 # sample size

control <- rnorm(N, 100, 5) # control group data

treatment <- rnorm(N, 110, 7) # control group dataLet’s imagine that you are studying an outcome like a mental health outcome.
Suppose that your control group has a mean score of 100, and a standard deviation of 5 on this outcome.
Suppose that your treatment group has a mean score of 110, and a standard deviation of 7 on this outcome.
options(scipen = 999) # turn off scientific notation
N <- 100 # sample size
control <- rnorm(N, 100, 5) # control group data
treatment <- rnorm(N, 110, 7) # control group data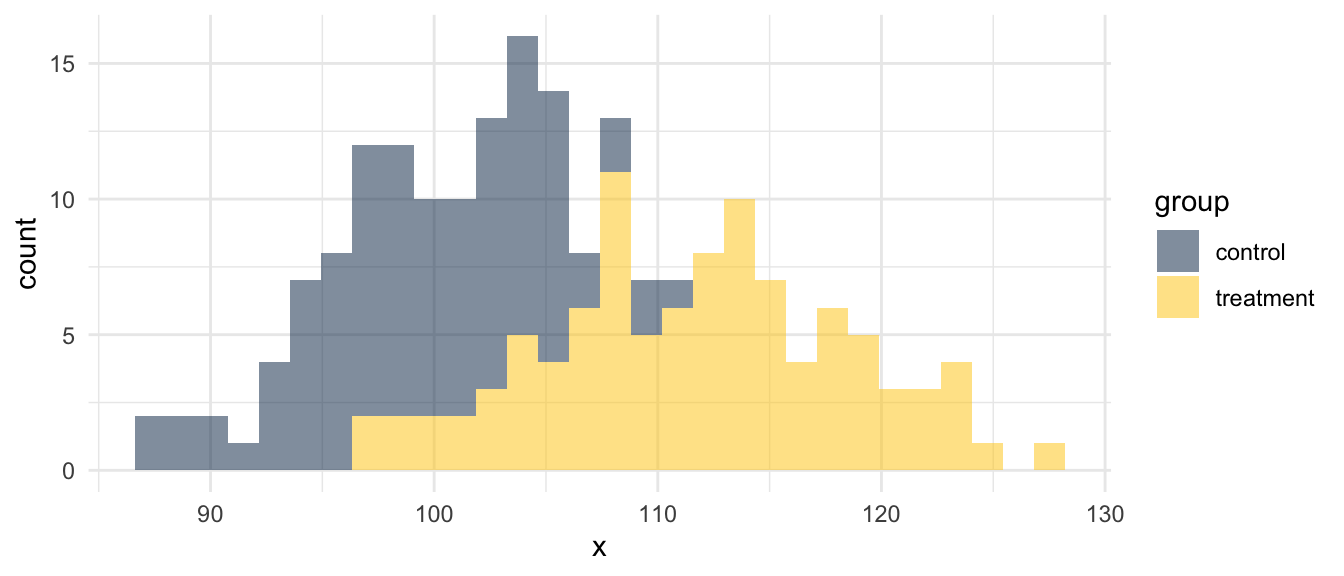
It’s relatively easy to test for the statistical significance of this difference, as one can see in the example below.
t.test(treatment, control) # t-test of treatment vs. control
    Welch Two Sample t-test

data:  treatment and control
t = 12.434, df = 177.7, p-value < 0.00000000000000022
alternative hypothesis: true difference in means is not equal to 0
95 percent confidence interval:
  8.828979 12.160125
sample estimates:
mean of x mean of y
108.90393 98.40938 But what if you want to think about the substantive significance of the difference between treatment and control group? Effect sizes are one way to think about these issues. Discussion about the merits of, and calculation of effect sizes is energetic and complex. However, one commonly accepted way of thinking about effect sizes is Cohen’s d.
I have recently updated my calculator to calculate and visualize Cohen’s d. It can be found here: https://agrogan.shinyapps.io/es_calculator/.