Show the code
library(ggplot2) # beautiful graphs

library(tidyr) # tidy datalibrary(ggplot2) # beautiful graphs
library(tidyr) # tidy datax <- c(1, 2, 3) # independent variable
y <- c(4, 5, 6) # first outcome
z <- c(7, 8, 3) # second outcome
mydata <- tibble(x, y, z)
mydata # replay mydata# A tibble: 3 × 3
x y z
<dbl> <dbl> <dbl>
1 1 4 7
2 2 5 8
3 3 6 3pivot_longermyReshapedData <- mydata %>%
pivot_longer(c(y, z), # values to pivot or reshape
names_to = "newnames", # names will be
values_to = "newvalues") # values will be
myReshapedData # replay myReshapedData# A tibble: 6 × 3
x newnames newvalues
<dbl> <chr> <dbl>
1 1 y 4
2 1 z 7
3 2 y 5
4 2 z 8
5 3 y 6
6 3 z 3geom_bar()ggplot(myReshapedData, # data I am using
aes(x = x, # x is newnames
y = newvalues, # y is newvalues
fill = newnames)) + # fill is newnames
geom_bar(stat = "identity") # y is actual bar height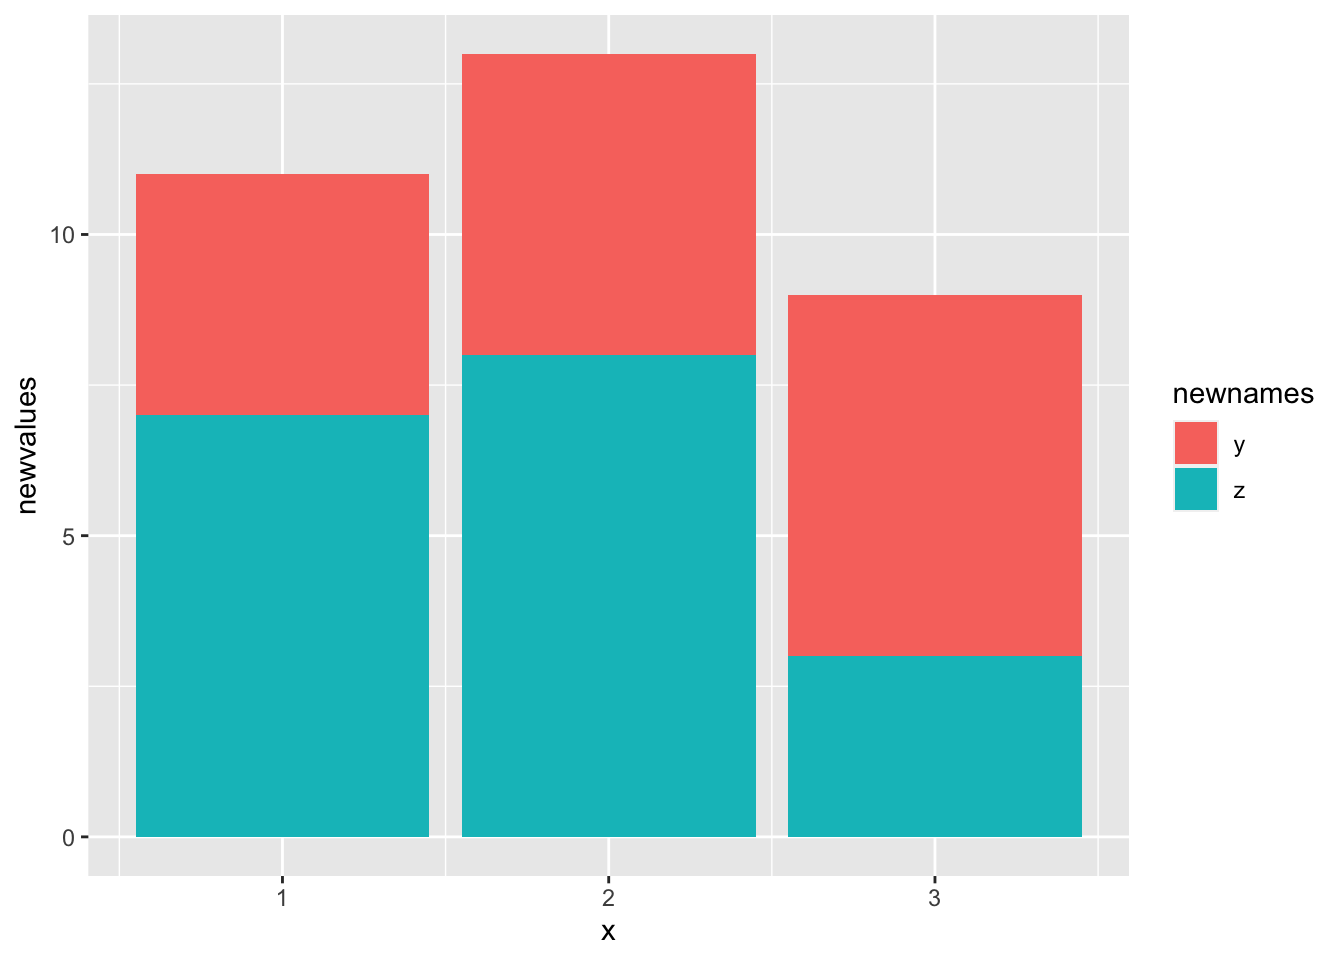
geom_col()By default, geom_col() assumes stat = 'identity' i.e. y is the height of the bar.
ggplot(myReshapedData, # data I am using
       aes(x = x, # x is newnames
           y = newvalues, # y is newvalues
           fill = newnames)) + # fill is newnames
  geom_col() # y is actual bar height
ggplot(myReshapedData, # data I am using
       aes(x = x, # x is newnames
           y = newvalues, # y is newvalues
           fill = newnames)) + # fill is newnames
  geom_bar(stat = "identity", # y is actual bar height
           position = position_dodge()) # unstack bars
ggplot(myReshapedData, # data I am using
       aes(x = x, # x is x
           y = newvalues, # y is value
           color = newnames, # color is key
           group = newnames)) + # line needs a group aesthetic
  geom_line()