Show the code
load("social-service-agency.RData")A quick look at moving from bar charts to pie charts.
A longer explanation of some issues is here: https://agrogan1.github.io/posts/bar-charts-in-ggplot2/
load("social-service-agency.RData")| age | program | gender |
|---|---|---|
| 23 | Program B | Male |
| 39 | Program C | Female |
| 26 | Program C | Female |
| 24 | Program D | Male |
| 36 | Program C | Female |
| 33 | Program C | Male |
ggplotlibrary(ggplot2)ggplot(clients, # data I am using
aes(x = program, # x is program
fill = program)) + # fill is also program
geom_bar() # use bars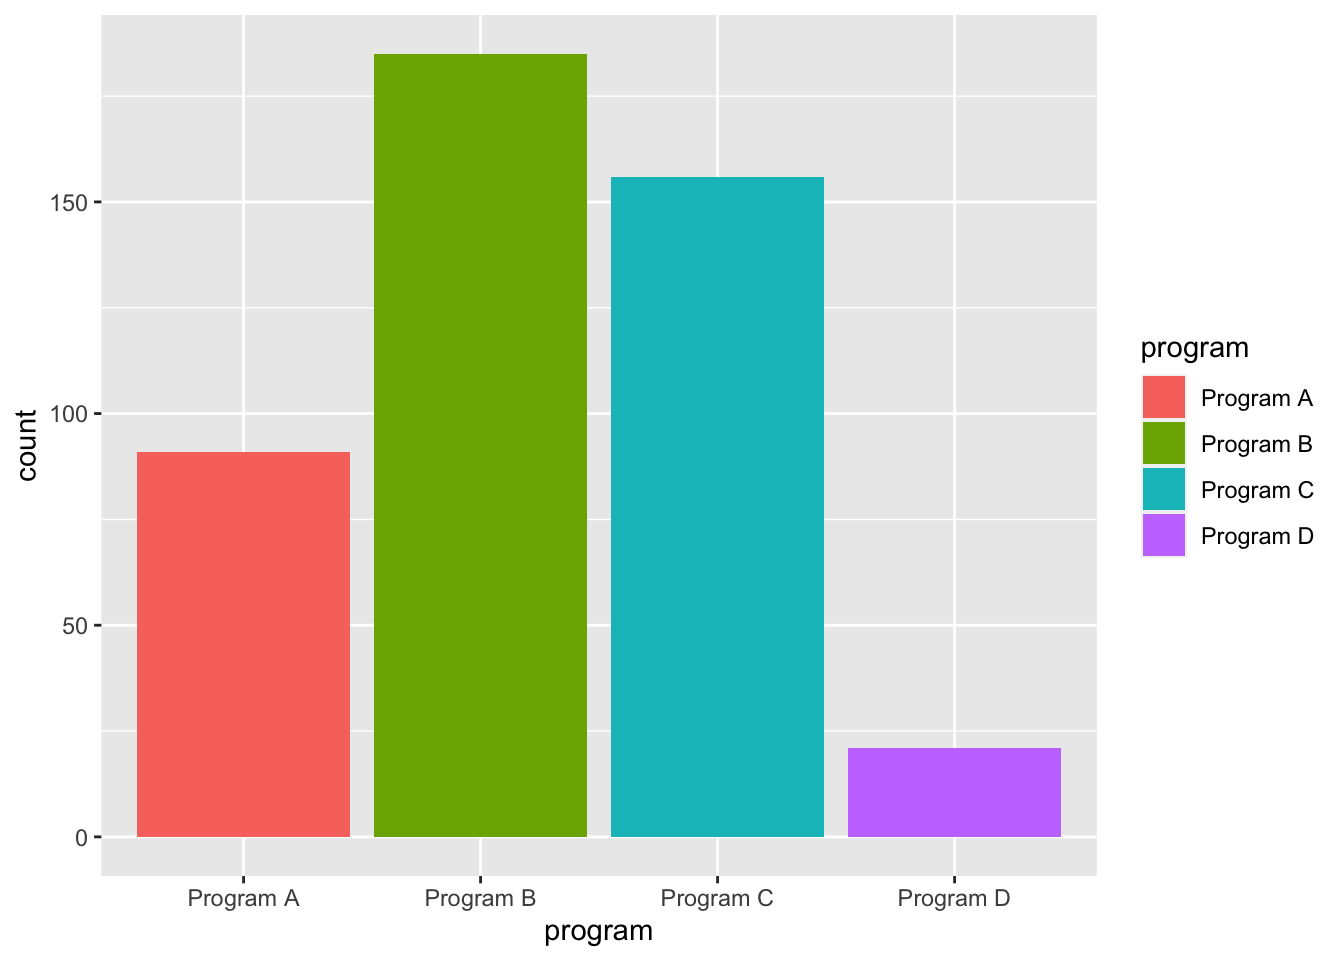
ggplot(clients, # data I am using
       aes(x = 1, # x is now 1 for everyone
           fill = program)) + # fill is program
  geom_bar() # use bars
ggplot(clients, # data I am using
       aes(x = 1, # x is now 1 for everyone
           fill = program)) + # fill is program
  geom_bar() + # use bars
  coord_polar(theta = "y") + # use polar coordinates
  theme_void() # blank theme for pie charts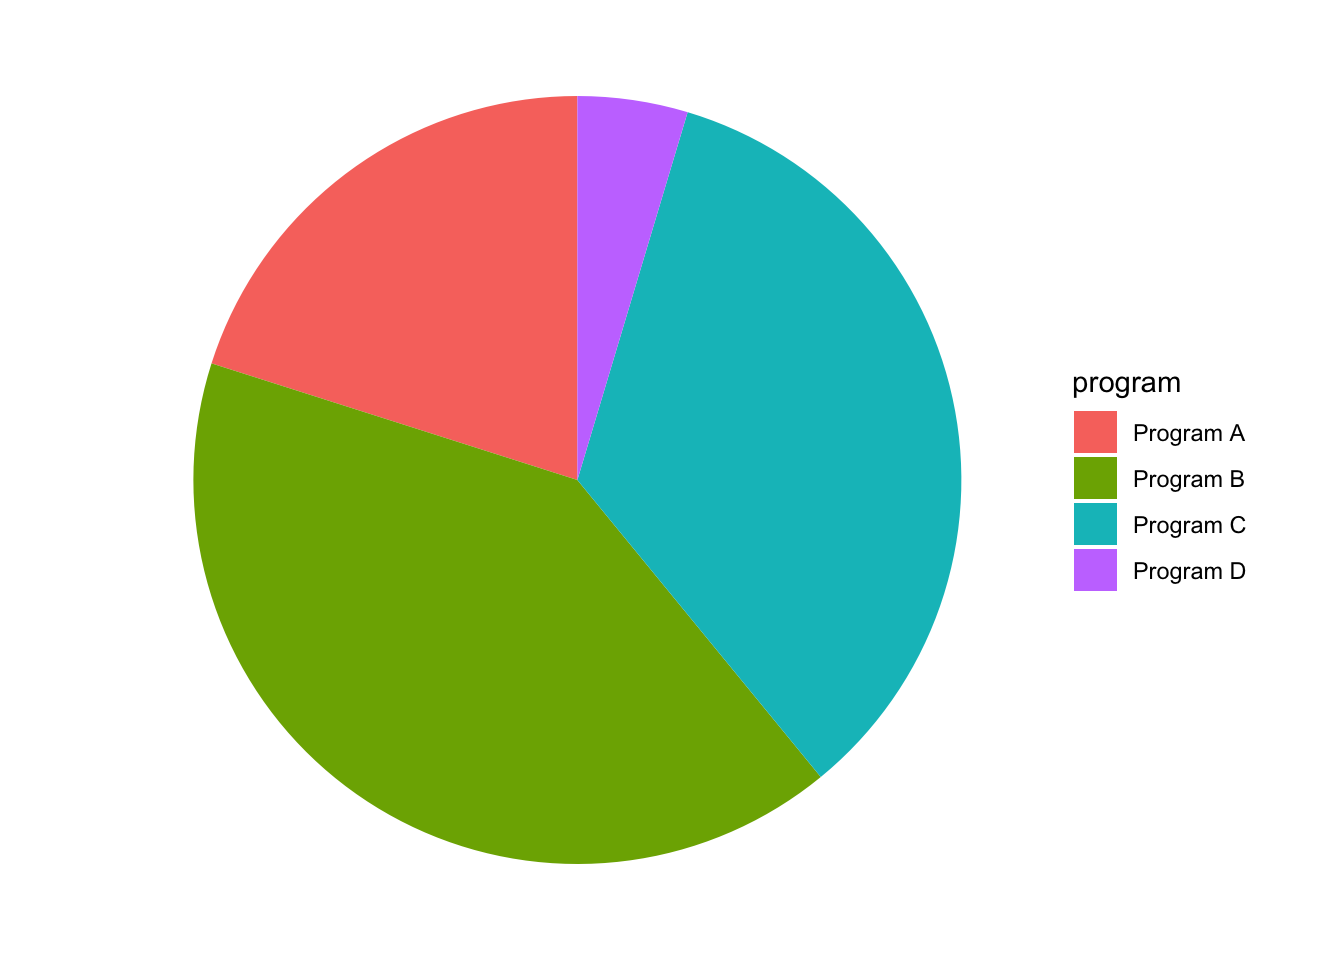
ggplot(clients, # data I am using
       aes(x = program, # x is back to program
           fill = gender)) + # fill is gender
  geom_bar() # use bars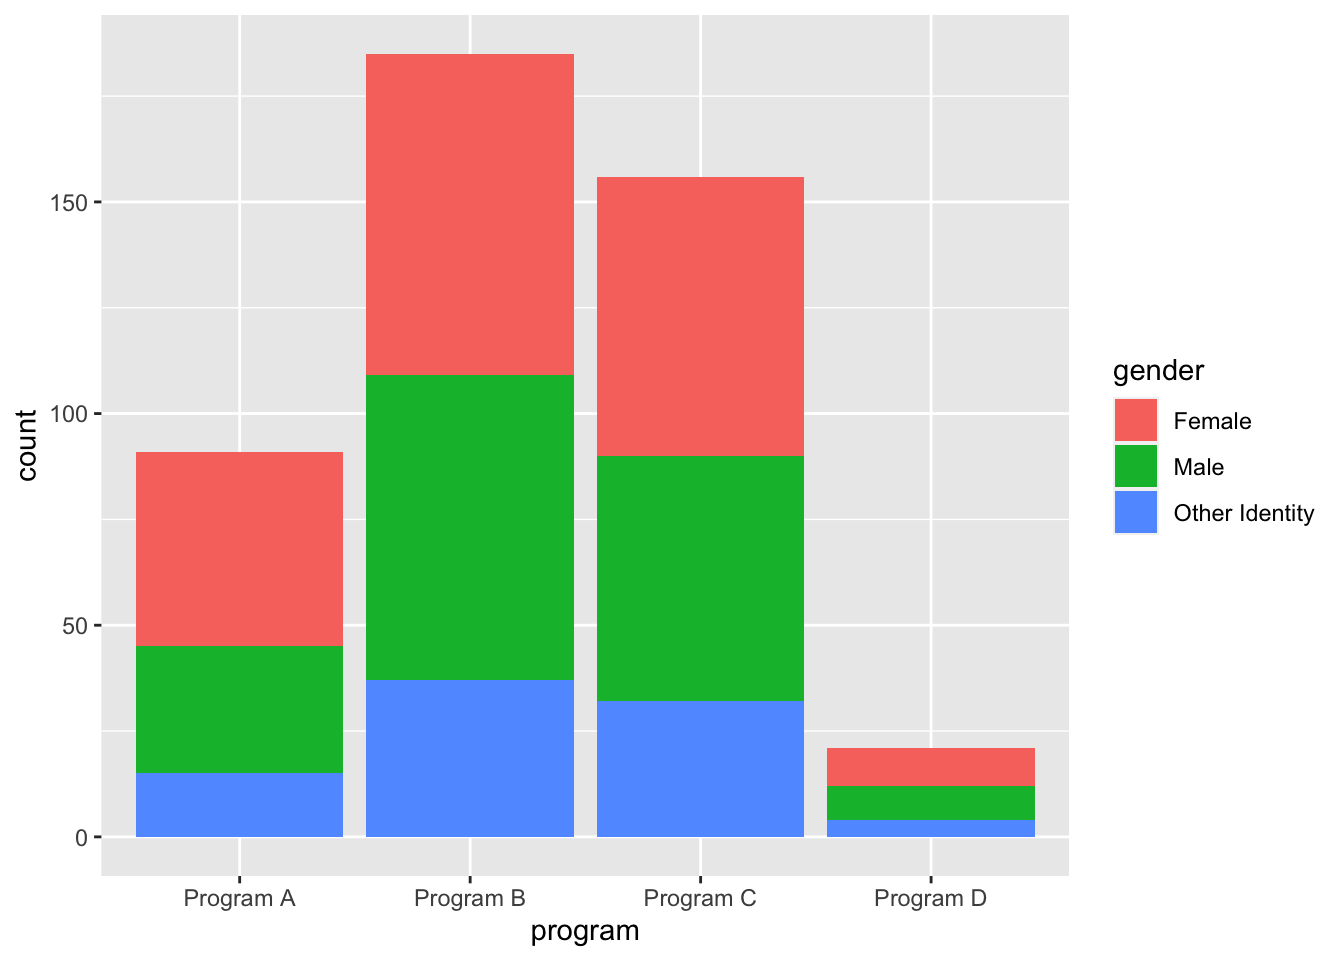
ggplot(clients, # data I am using
       aes(x = program, # x is back to program
           fill = gender)) + # fill is gender
  geom_bar(position = "dodge2") # unstack ('dodge') the bars
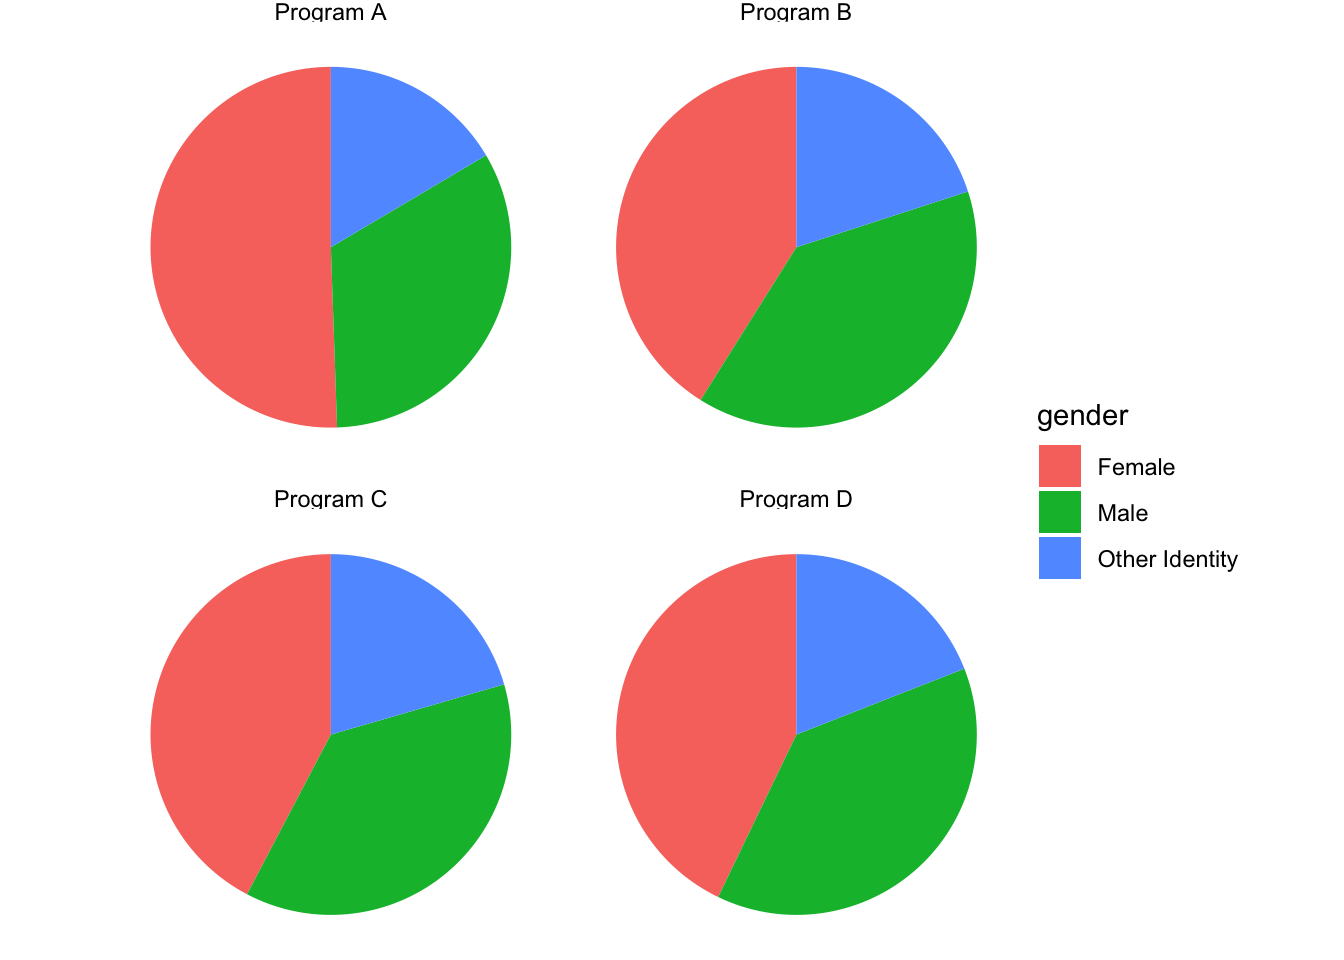
One approach …
# position = position_fill() makes the slices
# fill the pie in each facet

ggplot(clients, # data I am using
       aes(x = 1, # x is back to 1
           fill = gender)) + # fill is gender
  geom_bar(position = position_fill()) + # use bars
  coord_polar(theta = "y") + # polar coordinates
  facet_wrap(~program) + # facet wrap on program
  theme_void() # blank theme for pie charts