clear all

use "https://github.com/agrogan1/multilevel/raw/master/mlm-R2-gutten/gutten.dta"Introduction 🌲
There is sometimes a debate–shall we say–about whether Stata can make beautiful graphs, particularly in comparison to using ggplot in R. Below, I try to use as many of Stata’s options as I can to make a beautiful graph. I believe that this Stata graph comes close to being as beautiful of a graph as would be made by ggplot (and perhaps the syntax is a little more intuitive).
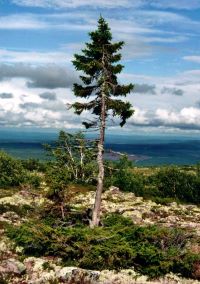
I use green and gold since they are common colors for forestry and park signage.
Data Source 🌲
The data used in this example are derived from the R package by Robinson & Hamann (2020).
According to the documentation, the source of these data are: “von Guttenberg’s Norway spruce (Picea abies [L.] Karst) tree measurement data.”
The documentation goes on to further note that:
“The data are measures from 107 trees. The trees were selected as being of average size from healthy and well stocked stands in the Alps.”
A Simple Graph 🌲
The default graphing scheme in Stata 18 is much improved over previous versions, and the below graph may be very good for many purposes.
use gutten.dta

twoway (scatter height age_base) (mspline height age_base)

graph export gutten0.svg, width(2000) replace

graph export gutten0.png, width(2000) replace
A Beautiful Graph 🌲
Below please find an admittedly complicated graph command. Note, however, that the graph builds upon basic ideas that we want a twoway graph, with a scatterplot and a mspline (median spline) smoother. Everything else is just an option to improve the appearance of the graph.
I make extensive use of the /// notation which allows me to spread the graph along multiple lines.
use gutten.dta

twoway /// two way graph
(scatter height age_base, /// scatterplot
mcolor(dkgreen%25) msymbol(circle) msize(medium)) /// dark green transparent markers
(mspline height age_base, /// median spline
lcolor(gold) lwidth(thick)), /// gold line
title("Tree Height by Tree Age") /// title
xtitle("Tree Age") /// title for x axis
ytitle("Tree Height") /// title for y axis
caption("Gutten Tree Data") /// caption
legend(order(1 "trees" 2 "median spline") position(6) rows(1)) /// better labels and format for legend
aspectratio(.5) // better aspect ratio

graph export gutten.png, width(2000) replace

graph export gutten.svg, width(2000) replace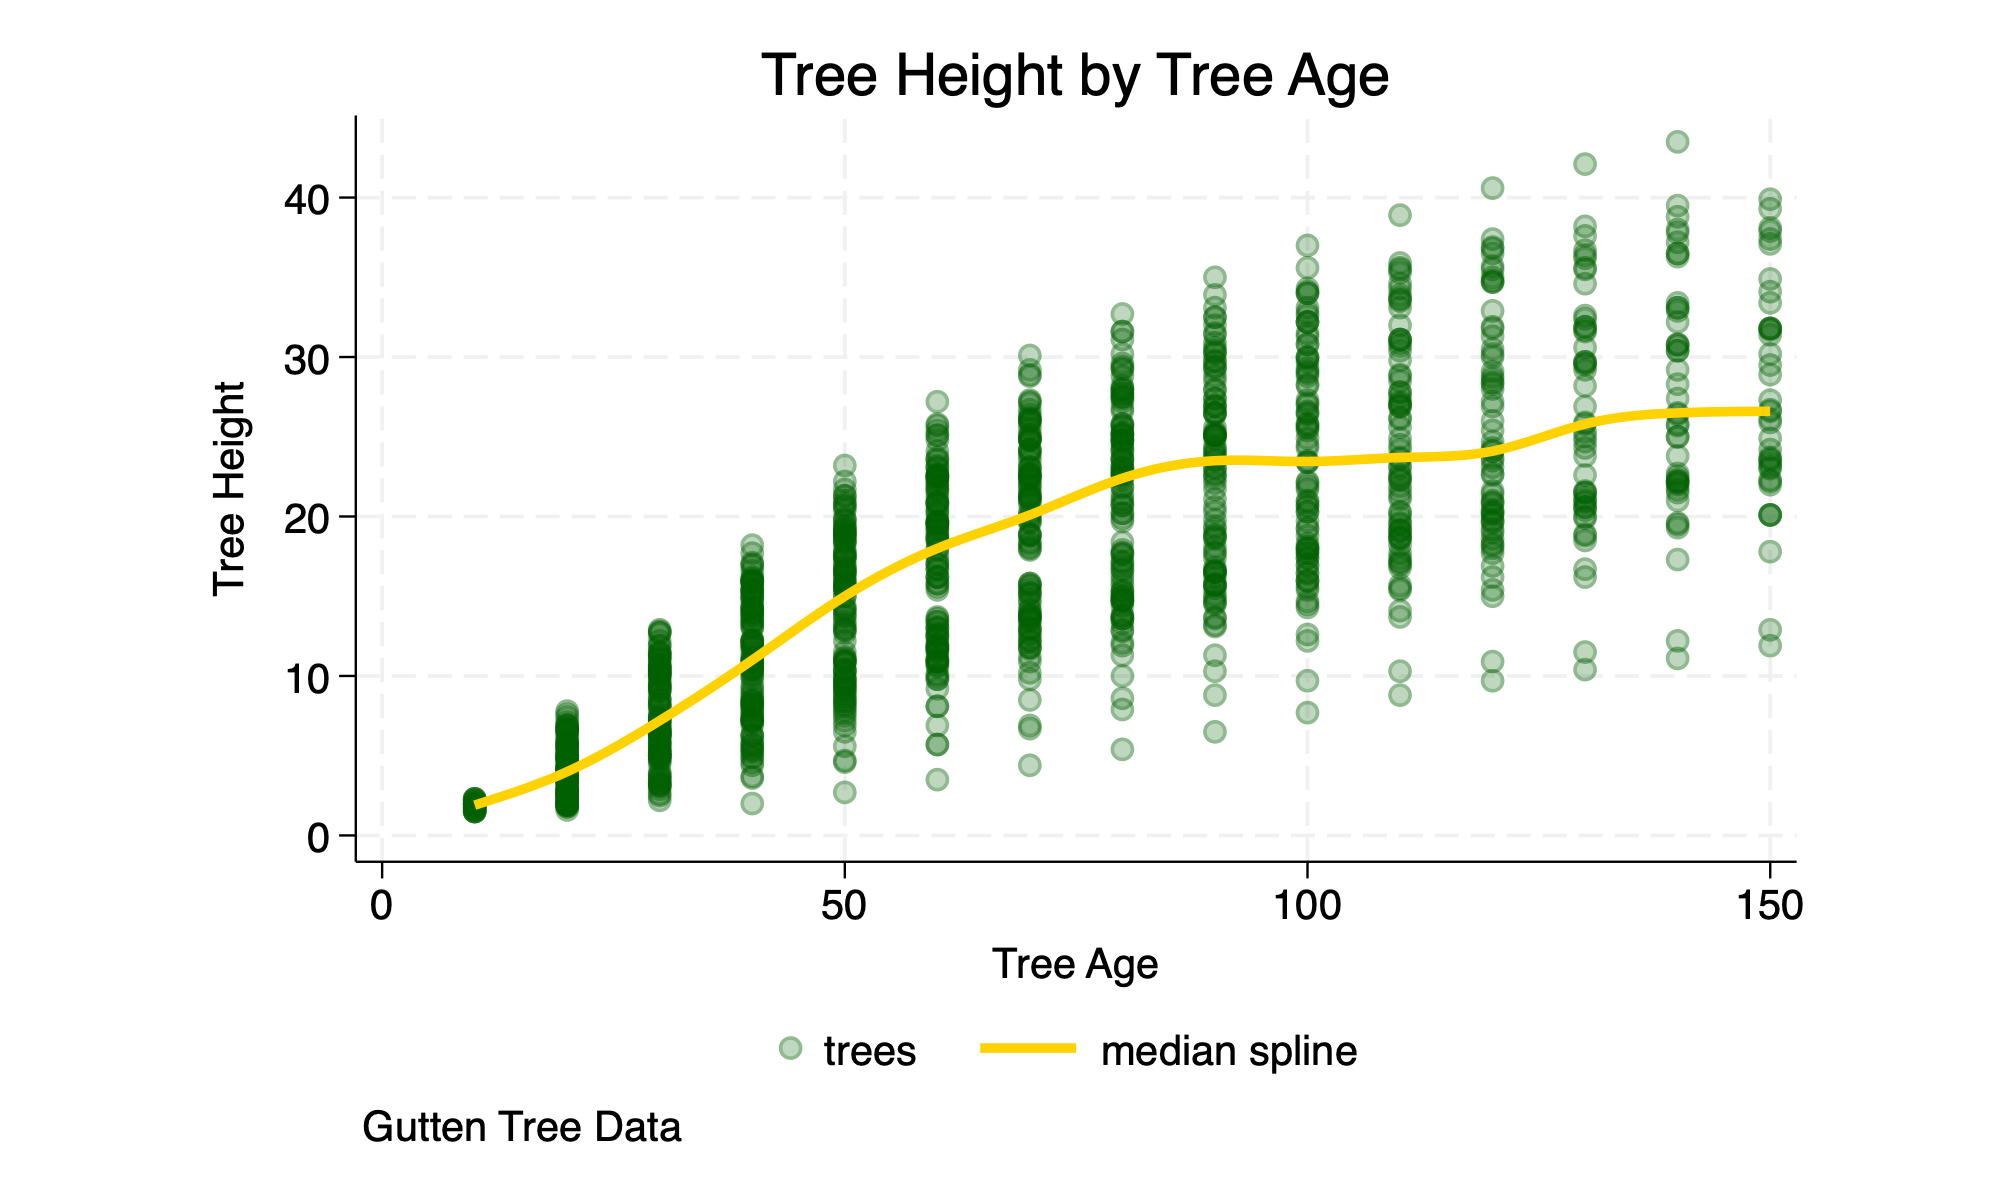
References
Robinson, A., & Hamann, J. (2020). FAwR: Functions and datasets for "Forest Analytics with R. https://doi.org/10.32614/CRAN.package.FAwR