Introduction
I’ve heard somewhere–I unfortunately forget exactly where–that a statistical model is nothing more than a principled statement about the data, that can be tested against the data. I think of moderation in that context.
Moderation is a kind of “statistical story” about different groups in the data.
As we build up to the idea of moderation, we are telling various “stories” about the data, and testing whether they are accurate.
Setup
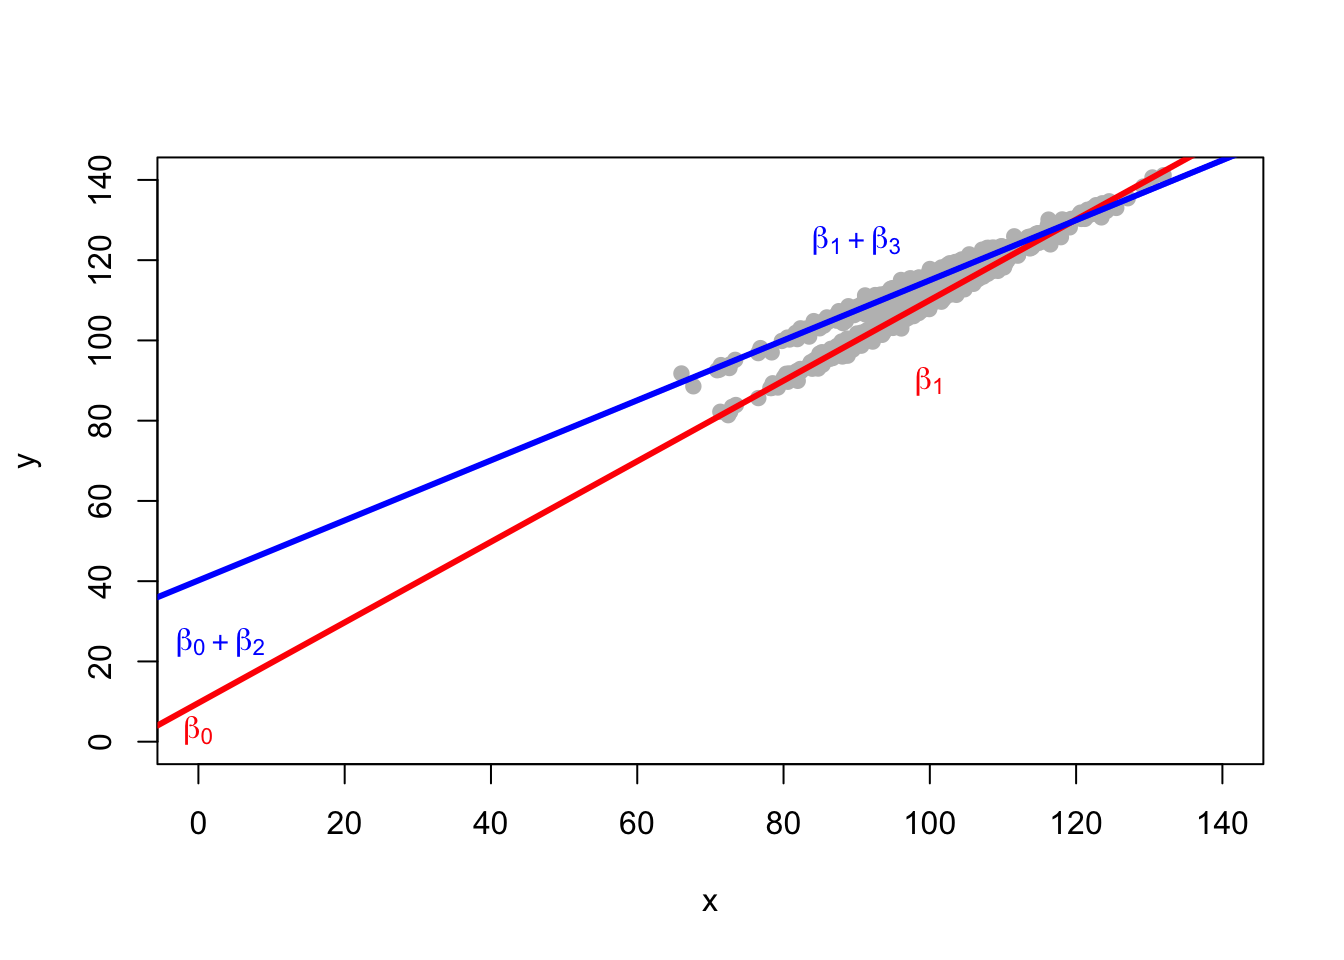
The Equation That Generates The Data
ImportantImportant
In practice, we usually don’t know this equation. We are trying to estimate it.
\[y_i = \beta_0 + \beta_1 x + \beta_2 \text{group} + \beta_3 (x \times \text{group}) + e_i\]
Numerically…
\[y_i = 10 + 1x + 30 \text{group} -.25 (x \times \text{group}) + e_i\]
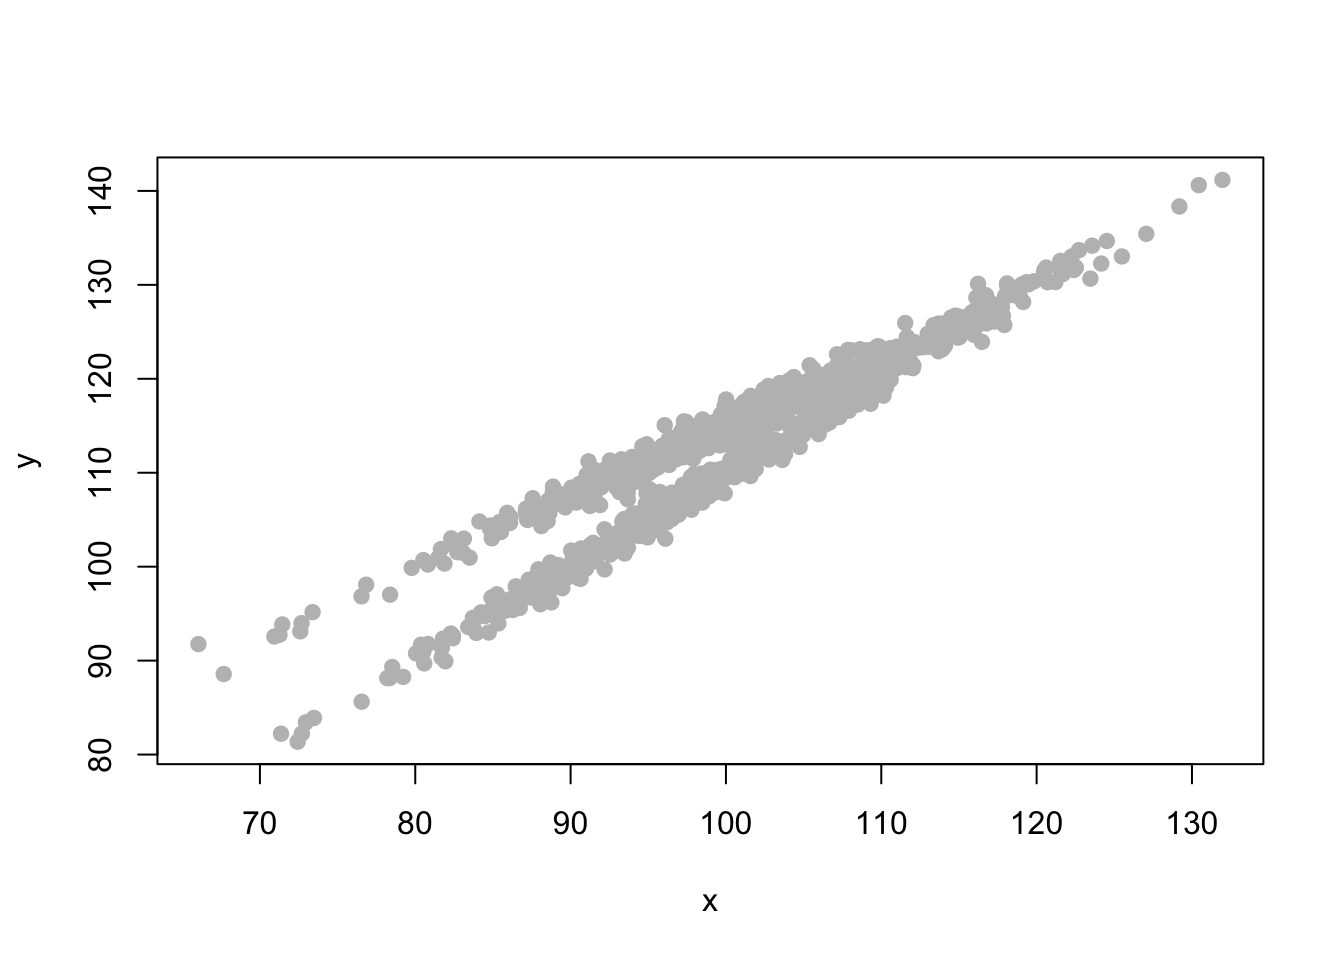
Simulated Data
Graph The Data
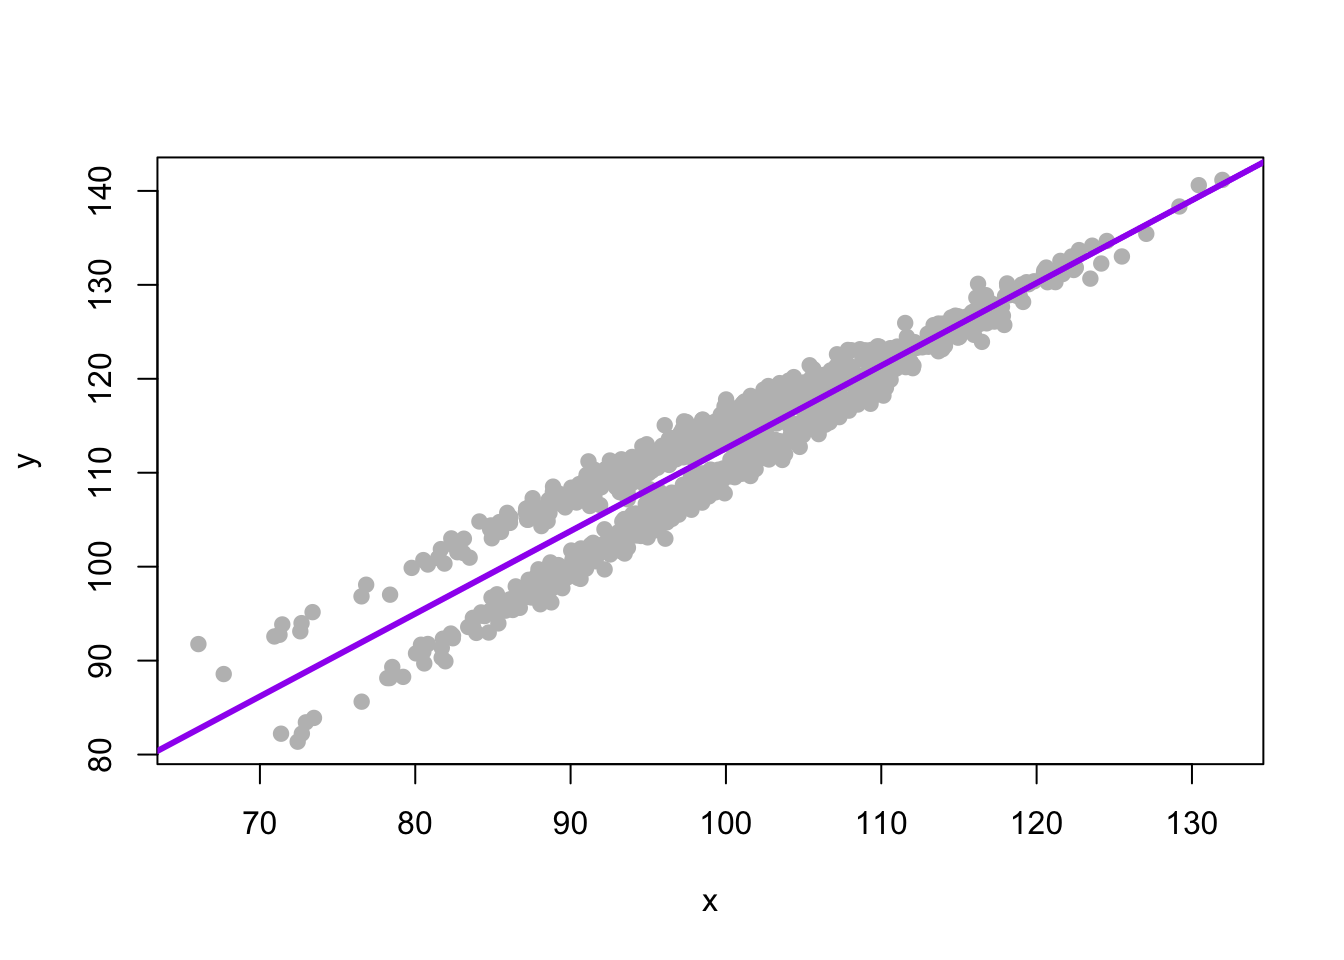
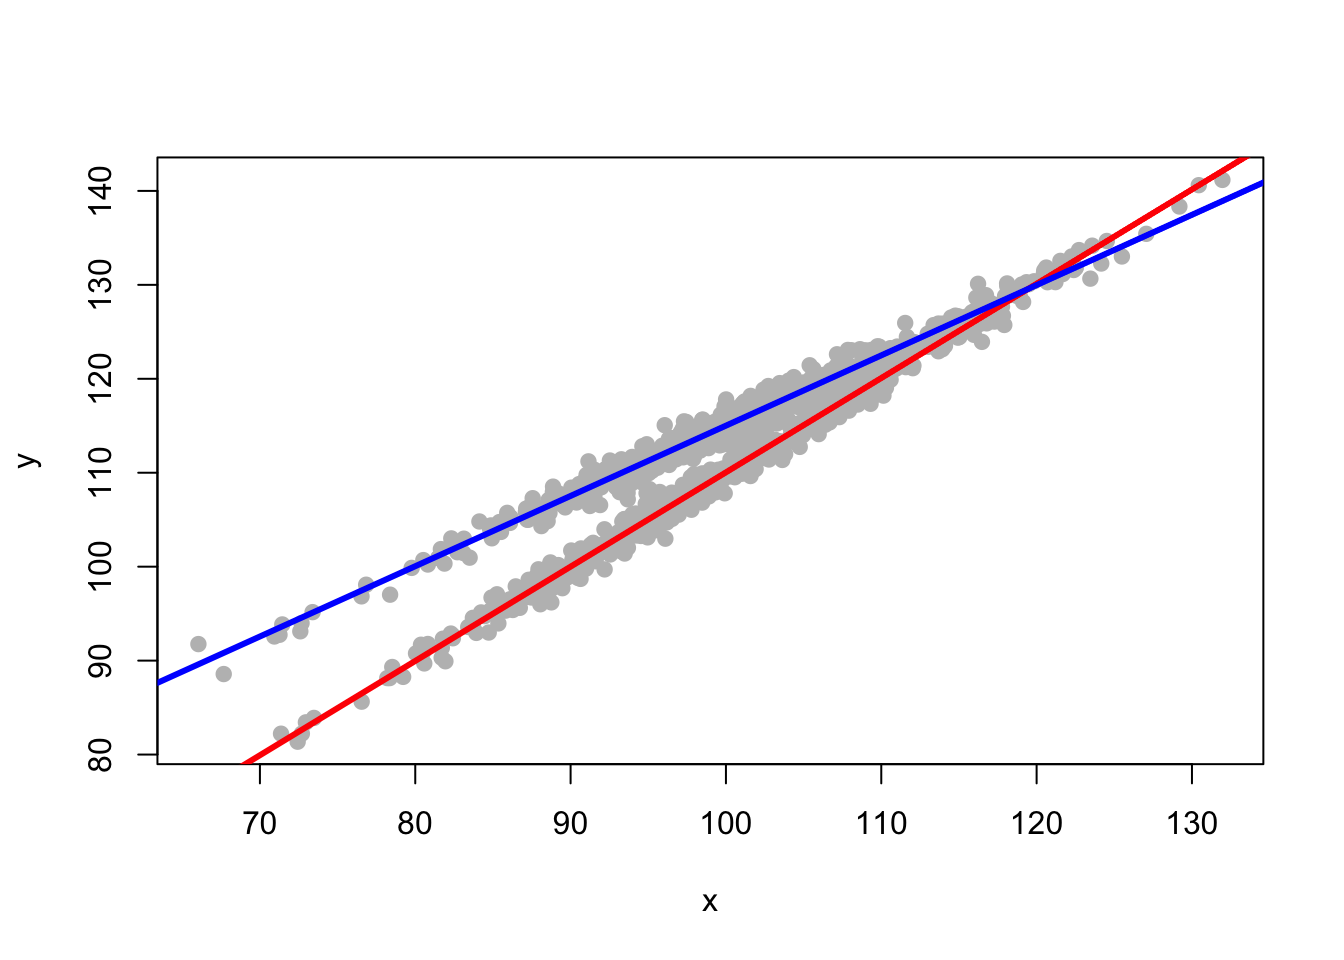
First Model: x Only
The Story
Our first story is that the regression coefficients function the same for everyone in the data set, regardless of the group that they are in. Everyone has the same \(\beta_0\), and the same \(\beta_1\) or regression slope.
Tipy Is A Function Of …
y is a function of an intercept, x and some error.
The Equation
\[y = \beta_0 + \beta_1 x + e_i\]
The Regression
| y | |||
|---|---|---|---|
| Predictors | Estimates | CI | p |
| (Intercept) | 24.57 | 22.70 – 26.45 | <0.001 |
| x | 0.88 | 0.86 – 0.90 | <0.001 |
| Observations | 1000 | ||
| R2 / R2 adjusted | 0.895 / 0.895 | ||
Graph The Regression
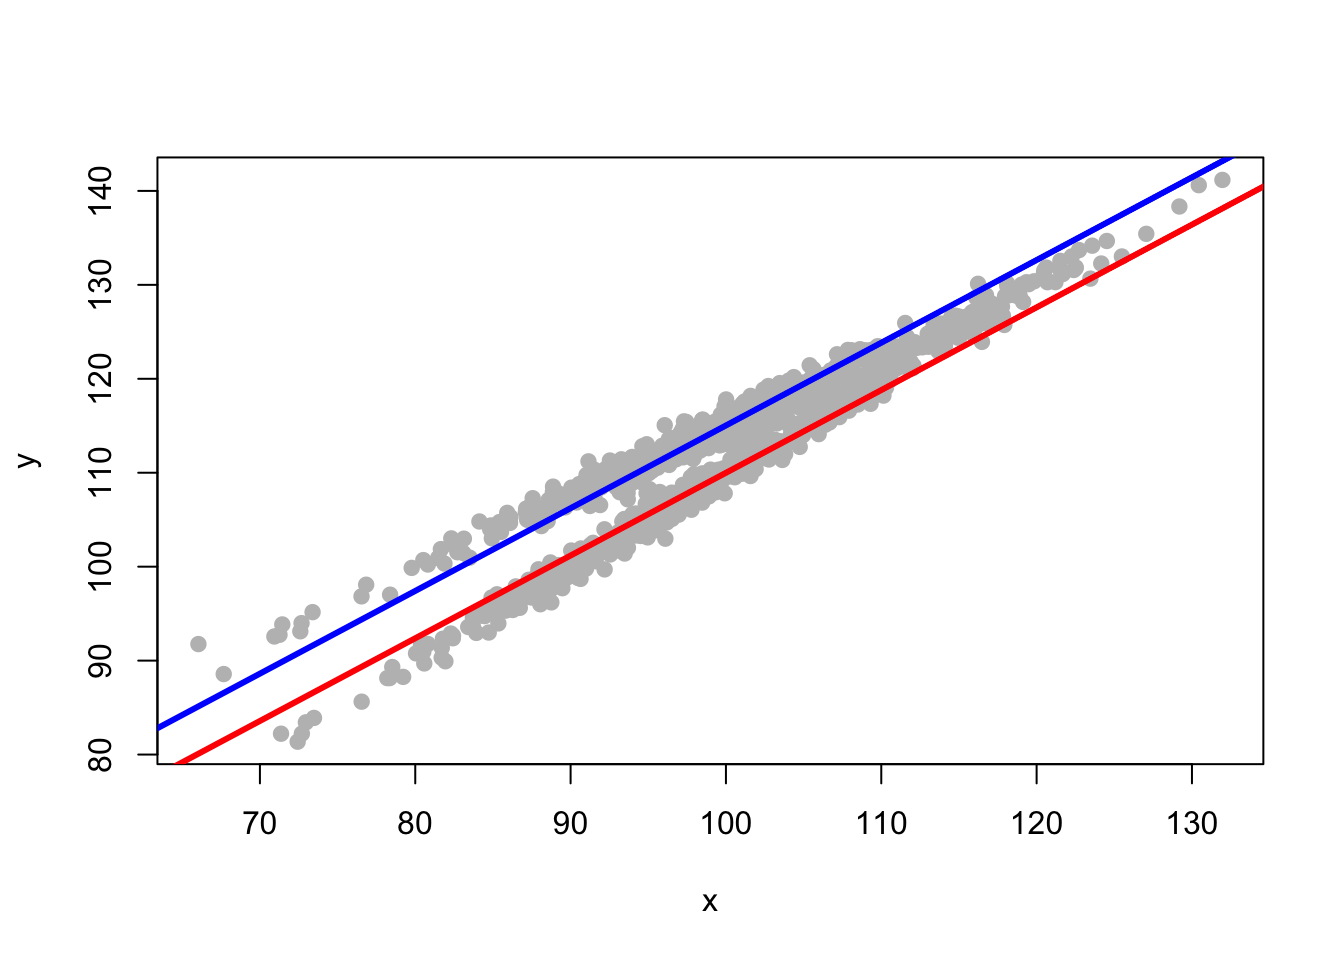
Second Model: x and group
The Story
Our second story is that one group has a different \(\beta_0\), a different intercept from the other group, But both groups have the same regression slope or \(\beta_1\).
Tipy Is A Function Of …
y is a function of an intercept, x, group membership, and some error.
The Equation
\[y = \beta_0 + \beta_1 x + \beta_2 group + e_i\]
The Regression
| y | |||
|---|---|---|---|
| Predictors | Estimates | CI | p |
| (Intercept) | 21.92 | 20.89 – 22.95 | <0.001 |
| x | 0.88 | 0.87 – 0.89 | <0.001 |
| group | 5.04 | 4.84 – 5.24 | <0.001 |
| Observations | 1000 | ||
| R2 / R2 adjusted | 0.969 / 0.969 | ||
Graph The Regression
Third Model: x and group and interaction of x and group
The Story
Our third and final story–and this is where interactions and moderation come in–is that each group has its own regression intercept, and each group now also has its own slope. One group has a slope of \(\beta_1\). The other group has a slope of \(\beta_1 + \beta_3\), where \(\beta_3\) indicates how the regression slope for the second group, is different from the regression slope for the first group.
Tipy Is A Function Of …
y is a function of an intercept, x, group membership, group membership multiplied by x, and some error.
The Equation
\[y = \beta_0 + \beta_1 x + \beta_2 group + \beta_3 x \times group + e_i\]
The Regression
| y | |||
|---|---|---|---|
| Predictors | Estimates | CI | p |
| (Intercept) | 9.65 | 8.75 – 10.54 | <0.001 |
| x | 1.00 | 0.99 – 1.01 | <0.001 |
| group | 30.54 | 29.25 – 31.83 | <0.001 |
| x × group | -0.26 | -0.27 – -0.24 | <0.001 |
| Observations | 1000 | ||
| R2 / R2 adjusted | 0.988 / 0.988 | ||
Graph The Regression
Summary of the Coefficients for Each Group
| Group | Intercept | Slope |
|---|---|---|
| 0 | \(\beta_0\) | \(\beta_1\) |
| 1 | \(\beta_0 + \beta_2\) | \(\beta_1 + \beta_3\) |
If we consider a group membership variable that has values 0 or 1, then effectively, the intercept for group 0 is \(\beta_0\) and the slope for group 0 is \(\beta_1\). For group 1, the intercept is \(\beta_0 + \beta_2\) while the slope is \(\beta_1 + \beta_3\).
\(\beta_2\) is thus the difference in intercepts between the two groups.
\(\beta_3\) is the difference in slopes between the two groups.