
Introduction
Across the world, there is a great deal of suffering. Many people deal with mental health problems or substance use issues. People often suffer the effects of discrimination, poverty, inequality, trauma, violence or conflict.
Understandably, many people and organizations try to develop interventions or programs for those who must deal with such difficulties.
Yet evaluating such social programs may be more difficult than it appears.
A Simple Evaluation
Let’s consider a simple evaluation of a program designed to improve mental health.
In its simplest form, an evaluation might consist of looking at the outcomes–e.g. mental health outcomes–for those who participate in a program.
---
config:
  look: handDrawn
  theme: default
---

flowchart LR

  program[program] --> outcome1[outcome]

  linkStyle 0 stroke:#000000,stroke-width:3px,font-size:36px,color:black;
If the program appears to be associated with better outcomes, we might be tempted to claim that the program is successful.
---
config:
  look: handDrawn
  theme: default
---

flowchart LR

  program[program] --> outcome1["better outcome"]:::forestgreen

  linkStyle 0 stroke:#000000,stroke-width:3px,font-size:36px,color:black;

  classDef forestgreen fill:#CDE498,stroke:#000000,stroke-width:2px,color:#000000;
Our Worry
However, we might wonder, or worry, about a number of issues. For example:
- What were the outcomes like for this group of people before they participated in the program? Were outcomes already favorable before the program?
- If the outcomes of the program were favorable, it might not be that the program is particularly helpful, but that people improve or get better naturally over time.
If we fail to account for these possibilities, we are potentially declaring a program successful, when in fact it has no effect. We are potentially advocating that scarce time, energy, and money be put into this program, when our resources would be better allocated elsewhere.
Advocating for programs which have not been successfully evaluated, and which are not backed up by evidence, could thus be seen as an ethical issue. Put another way, we should be advocating that programs be implemented only if they are evidence based.
A More Sophisticated Evaluation
A more sophisticated research design would be to have one group of people–a program group–participate in the program, while another group–a comparison group–does not participate. We would then compare outcomes across the two groups.1
---
config:
  look: handDrawn
  theme: default
---

flowchart LR

  programgroup["program group"] --> program

  program[program] --> outcome1[outcome]

  comparisongroup["comparison group"] ---> outcome0[outcome]

  linkStyle 0,1,2 stroke:#000000,stroke-width:3px,font-size:36px,color:black;
We hope that our results will show that those participants who have participated in the program group have better outcomes than those who were members of the comparison group.
---
config:
  look: handDrawn
  theme: default
---

flowchart LR

  programgroup["program group"] --> program

  program[program] --> outcome1[better outcome]:::forestgreen

  comparisongroup["comparison group"] ---> outcome0[outcome]

  linkStyle 0,1,2 stroke:#000000,stroke-width:3px,font-size:36px,color:black;

  classDef green fill:#80BD41,stroke:#000000,stroke-width:2px,color:#000000;

  classDef springgreen fill:#00FF7F,stroke:#000000,stroke-width:2px,color:#000000;

  classDef forestgreen fill:#CDE498,stroke:#000000,stroke-width:2px,color:#000000;
Different Subgroups of Individuals
One big question or concern in conducting an evaluation of this type is that our group of participants may be composed of different subgroups of individuals. These groups might be different in that they might represent individuals of different racial, ethnic or gender identities, might be people from different communities, or might have quite different sets of past experiences.
---
config:
  look: handDrawn
  theme: default
---

flowchart TB

  subgraph study["study participants"]

  A["Group A: 100 people"]

  B["Group B: 100 people"]

  end
Are Those In the Program Group And Comparison Group Similar?
If participants from Group A and Group B are evenly distributed across the program and comparison groups, then we are not worried about the idea that an apparent effect of the program is because of unequal allocation of groups to the program.
---
config:
  look: handDrawn
  theme: default
---

flowchart LR

subgraph study["study participants"]

  A["Group A: 100 people"]

  B["Group B: 100 people"]

  end

  A --> |"roughly 50"| programgroup["program group"]

  B --> |"roughly 50"| programgroup["program group"]

  programgroup["program group"] --> program

  program[program] --> outcome1[outcome]

  A --> |"roughly 50"| comparisongroup

  B --> |"roughly 50"| comparisongroup

  comparisongroup["comparison group"] ---> outcome0[outcome]

  linkStyle 0,1,2,3,4,5,6 stroke:#000000,stroke-width:3px,font-size:14px,color:red;
Random Assignment
One way of accomplishing this even distribution would be by randomly assigning participants to the program.
Random assignment helps to ensure the internal validity of a program evaluation. If the evaluation finds that outcomes in the program group are better than those in the control group, we can be confident that this is due to the effects of the program.
---
config:
  look: handDrawn
  theme: default
---

flowchart LR

subgraph study["study participants"]

  A["Group A: 100 people"]

  B["Group B: 100 people"]

  end

  A --> |"roughly 50 RANDOMLY ASSIGNED"| programgroup["program group"]

  B --> |"roughly 50 RANDOMLY ASSIGNED"| programgroup["program group"]

  programgroup["program group"] --> program

  program[program] --> outcome1[outcome]

  A --> |"roughly 50 RANDOMLY ASSIGNED"| comparisongroup

  B --> |"roughly 50 RANDOMLY ASSIGNED"| comparisongroup

  comparisongroup["comparison group"] ---> outcome0[outcome]

  linkStyle 0,1,2,3,4,5,6 stroke:#000000,stroke-width:3px,font-size:14px,color:red;
Random Assignment Is Sometimes Not Possible
However, often the nature of the program is such that we want to allow participants in the study to select their own level of participation, or non-participation, in the program.
Often funders have objections to random assignment. Often the individuals or communities who are participating in the evaluation of a program may have valid objections to random assignment.
Sometimes, instead of relying on random assignment, we may wish to observe the effects of a program more naturalistically.
And lastly, the logistical demands of random assignment may require smaller samples, as well as shorter time frames, when we wish to observe the outcomes of a program with a larger more generalizable sample of participants2, or over a longer time frame3. Generalizability is often termed external validity.
When Participants Choose Their Own Level Of Participation
So far in this discussion we have been focusing on improving our research design. Randomly assigning participants to a control group or program group might be thought of as one way of improving the internal validity of an evaluation by improving the research design.
If participants select their own participation, then it is likely that many background characteristics of participants–such as their age, gender, socio-economic resources, and motivation–will affect their decision to participate, and their level of participation.
---
config:
  look: handDrawn
  theme: default
---

flowchart LR

participation{participation <br>decision}

age --> participation

gender --> participation

ses["socio-economic status"] --> participation

motivation --> participation

background --> participation

history --> participation

participation --> programgroup["program group"]

participation --> comparisongroup["comparison group"]

programgroup --> program

program[program] --> outcome1[outcome]

comparisongroup["comparison group"] ---> outcome0[outcome]

  linkStyle 0,1,2,3,4,5,6,7,8,9,10 stroke:#000000,stroke-width:3px,font-size:36px,color:black;
When randomization is not possible, accounting for all of these different background characteristics is likely to be difficult to accomplish only with one’s research design.
If, for example, more motivated individuals and those with more socio-economic resources are the ones who choose to participate in the program, then any better outcomes might not be the result of the program, but a result of the characteristics of individuals who chose to participate.
---
config:
  look: handDrawn
  theme: default
---

flowchart LR

  programgroup["program group <br>(more motivated <br>better SES)"]:::forestgreen --> program

  program[program] --> outcome1[better outcome]:::forestgreen

  comparisongroup["comparison group"] ---> outcome0[outcome]

  linkStyle 0,1,2 stroke:#000000,stroke-width:3px,font-size:36px,color:black;

  classDef springgreen fill:#00FF7F,stroke:#000000,stroke-width:2px,color:#000000;

  classDef forestgreen fill:#CDE498,stroke:#000000,stroke-width:2px,color:#000000;
What To Do?
When participation in a program is not randomly assigned, we need to think about a way to account for, or model the various background and demographic factors that may be different between participants and non-participants.
A Simple Model of the Data
Let’s start with a simple visual model of the data.
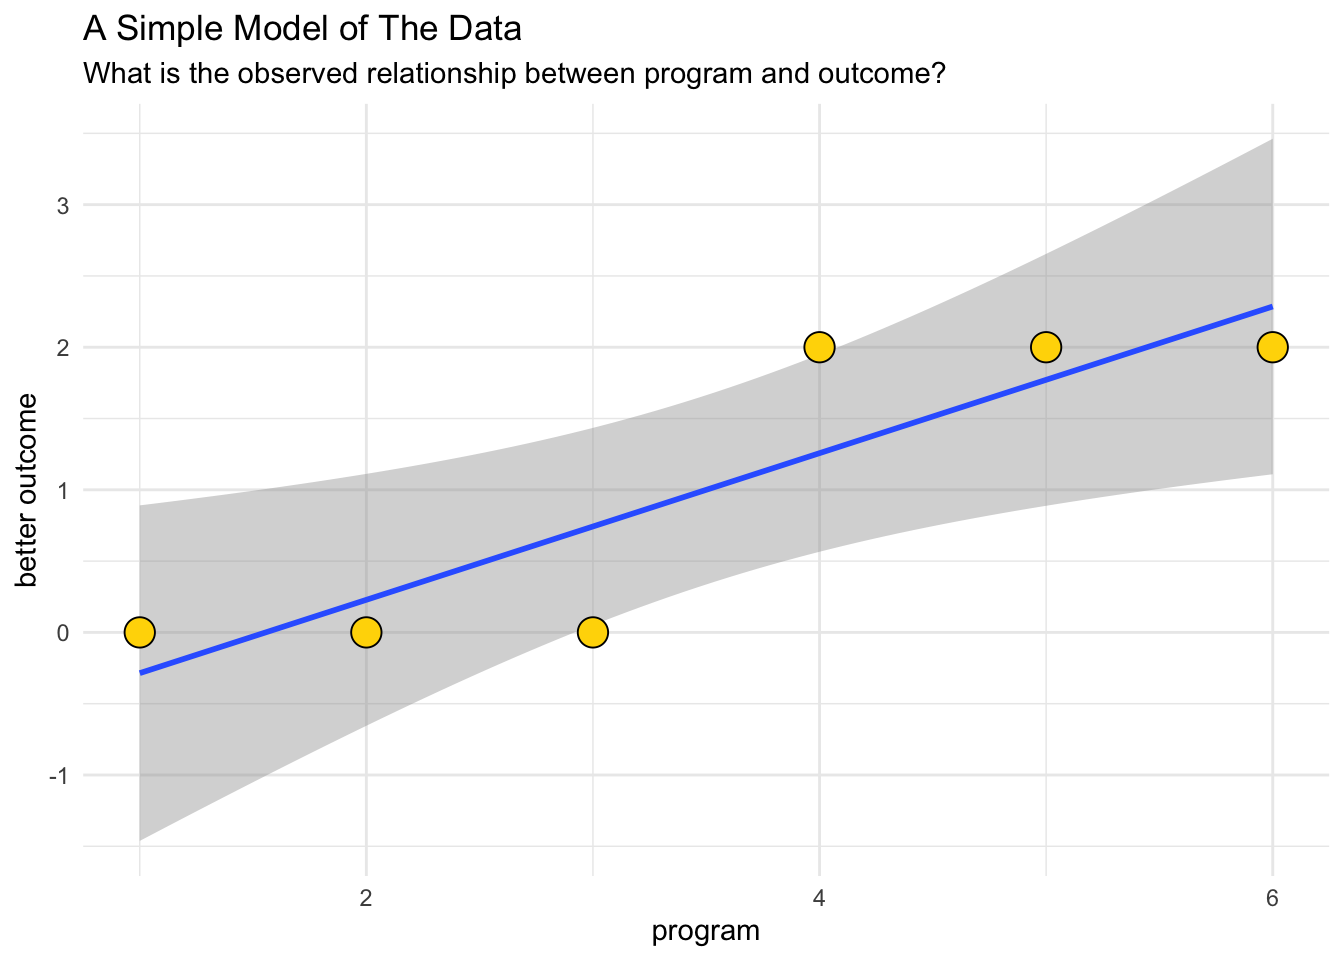
TipKey Takeaway
This simple model of the data (Figure 11) appears to indicate that the more participation in the program is associated with more of the better outcome.
Here we are considering two aspects, or dimensions of the data: participation in the program; and level of the better outcome.
A More Complicated Model of the Data
However, our understanding becomes more complicated if we consider more dimensions of our study (Figure 12). Let’s consider participation in the program, the level of the outcome, but also the fact that there are different groups of people in the study.
For example, there might be a more highly motivated group, and a less motivated group.
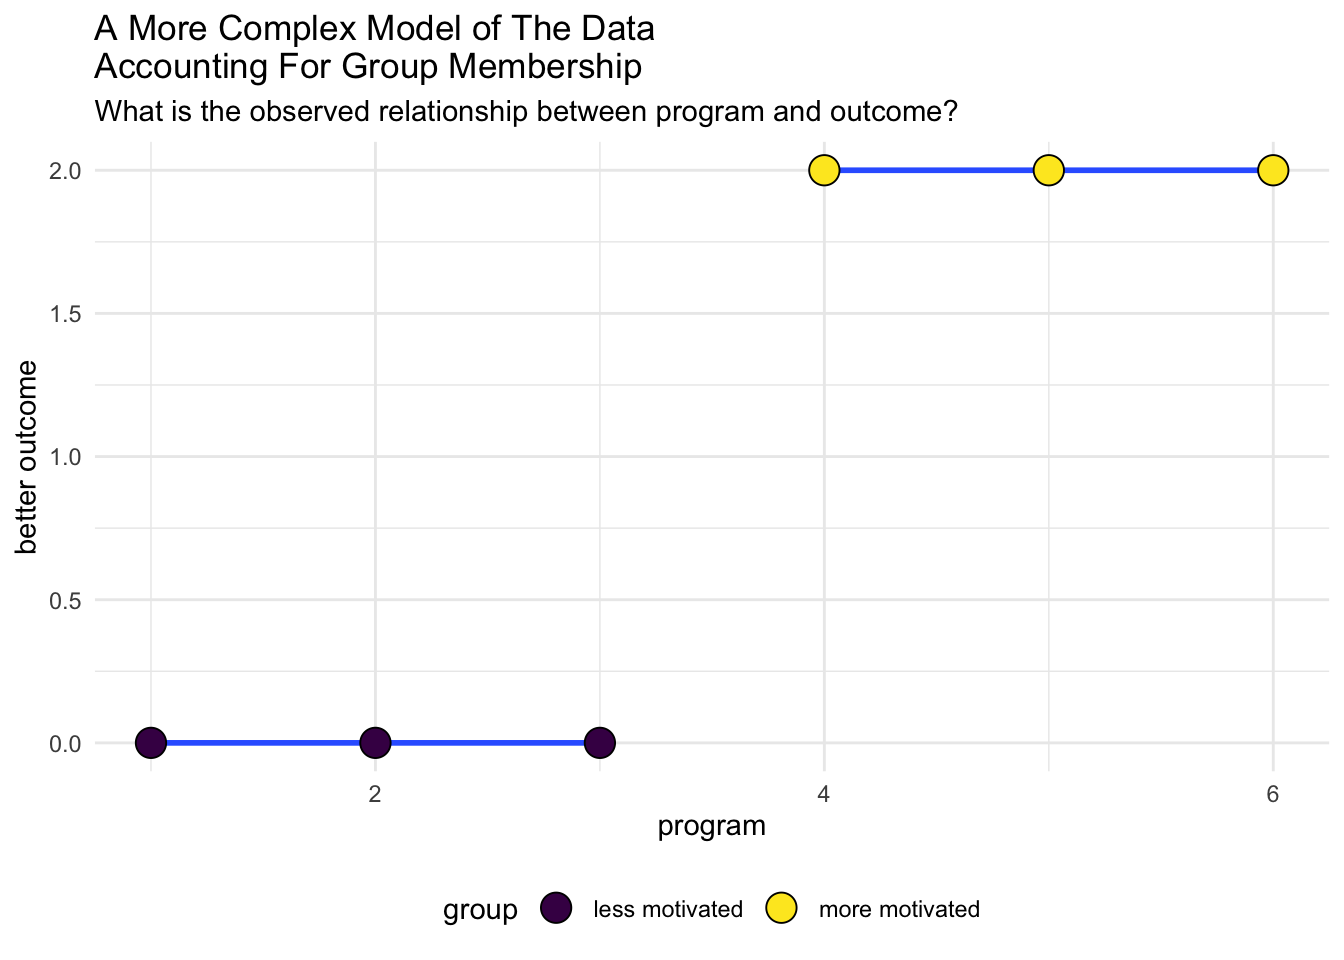
We see that when we consider a third dimension of the data, motivation, that our analysis changes. People with higher levels of motivation are more likely to participate in the program, but among both people with higher levels of motivation, and people with lower levels of motivation, participation in the program is associated with no difference in the good outcome.
TipKey Takeaway
In essence, after considering people’s pre-existing levels of motivation, the program has no effect!
Since we are considering three dimensions of the data, it may be illustrative to provide a 3 dimensional graph. This three dimensional graph illustrates the same idea as Figure 12: more participation in the program initially appears to be associated with better outcomes; after consideration of the third factor of motivation, the program appears to have no effect!
Accounting For, Ruling Out, Or Controlling For Background Factors
Accounting for, ruling out, or controlling for multiple background factors is one of the major reasons we use statistics.
Using statistical modeling allows us to control for multiple background factors when doing so by improving our research design is not possible.
While a full treatment of statistics is beyond the scope of this presentation, the annotated equation (Figure 14) below gives some idea of the logic of statistics.
An Example Equation
In Figure 14 we are estimating the association of the program with the outcome, while accounting for motivation, while simultaneously estimating the association of motivation with the outcome while accounting for program participation. We are also controlling for the level of the outcome at time 1.
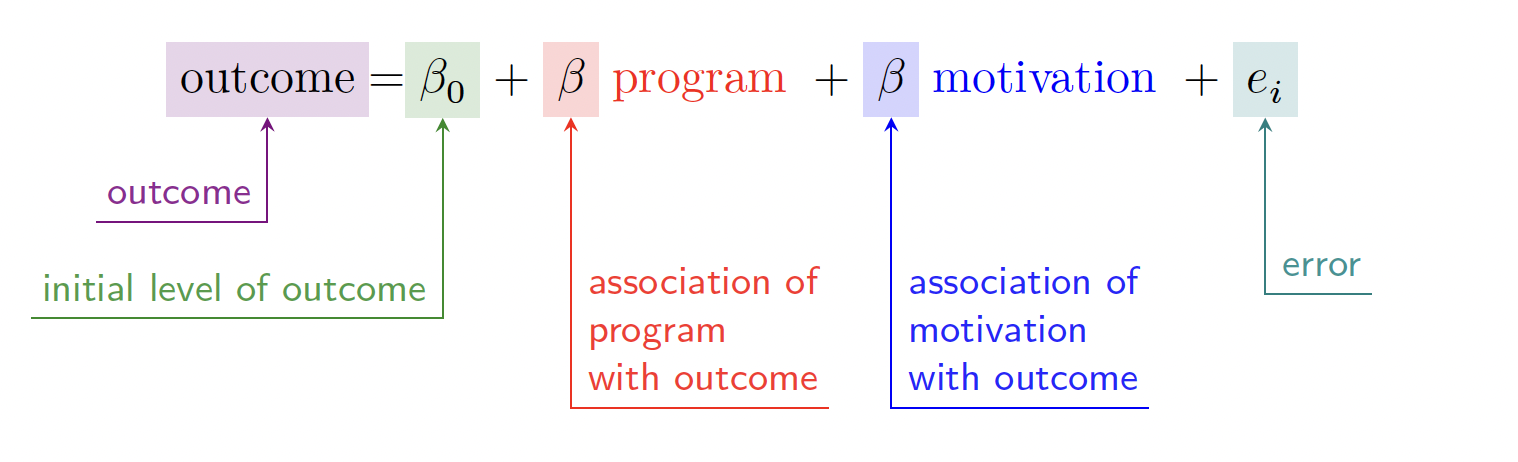
Mathematically, we are essentially estimating a multidimensional plane in multidimensional space.
Visually
Visually, this is equivalent to the three dimensional figure that we encountered in our visual exploration.
Models Are Written Down As Equations
Briefly, one of the major advantages of a statistical approach is that we can write out–and estimate–a much longer equation or statistical model accounting for multiple possible confounding factors. For example, I could easily represent the complex dynamics influencing participation in the program that are illustrated in Figure 9 as an equation (Equation 1), and estimate that equation to estimate outcomes associated with the program, while accounting for multiple other possible confounding factors
TipA Possible Equation
A possible equation to estimate this model might look something like the below.
\[\begin{aligned} & \text{outcome} = \\ & \beta_0 + \beta \text{age} + \beta \text{gender} + \beta \text{SES} + \beta \text{motivation} \ + \\ & \Sigma \beta \text{background} + \Sigma \beta \text{history} + e_i \end{aligned} \tag{1}\]
Conclusion
Evaluation of social programs is complicated, but necessary, to ensure that social programs are evidence based, and that programs represent a wise and responsible use of time, energy and money for people who are often suffering or vulnerable. The internal validity of a program is strengthened when we can use a research design where we randomly assign participants to a program group and a control group, and compare the outcomes.
However, there are often valid and important reasons that we cannot use random assignment.
Equally important is the idea of external validity. We need to ensure that the results of our evaluation are generalizable across different demographic and identity groups, cultures, or countries.
Thus, there is an important role for the use of more complicated visual and statistical models to evaluate social programs. Generating robust evidence for these programs can be seen as an ethical responsibility.
Footnotes
Valid questions could be raised about the ethics of such an approach, specifically denying participation in the program to one group of people. If a program is of unknown benefit, it is ethical to evaluate this program with a comparison group approach–where the comparison group is offered the usual level of care–because it is not yet known whether the program confers benefit on its participants, and whether the program represents a valid use of time, energy and financial resources, or whether the program is a waste of resources, and of participants’ time. Indeed, an evaluation might uncover the fact that the program has no beneficial effects, or even that the program is harmful! Once a program has been established as beneficial, it would likely be unethical to conduct an evaluation where the program is withheld from some participants. However, we could then consider a comparison of the program with an enhanced version of the program that might confer even more benefits.↩︎
Increasingly we are aware that an evaluation conducted with a small selected group of participants may not generalize well to other groups of people with different demographic or identity characteristics, who are from different cultures, or who live in different countries.↩︎
Somewhat relatedly, results that are observed over a shorter time frame (e.g. several months or a year) may not generalize to longer time frames such as several years or many years.↩︎