Background
I’m sometimes asked for a quick outline of how to proceed with a multilevel analysis. Below are the steps that I would use in Stata, though they would be very conceptually similar in R.
Get acquainted with your data
Figure out what variables correspond to what measures and constructs. e.g.:
lookfor healthlookfor sesdescribe question37
Prepare and clean your data
Rename variables to be more intuitive. e.g.:
rename q21 health
Recode missing values. e.g:
recode health (99=.)
Keep only necessary variables.
keep age race sex ses health q21 neighborhood
Descriptive statistics
summarize continuousvarstab1 categoricalvars
And in more recent versions of Stata
dtable continousvars i.categoricalvar1 i.categoricalvar2
Multilevel model
mixed y || groupid: // unconditional modelestat iccmixed y x1 x2 || groupid:mixed y x1 x2 || groupid: x1 x2
Graph
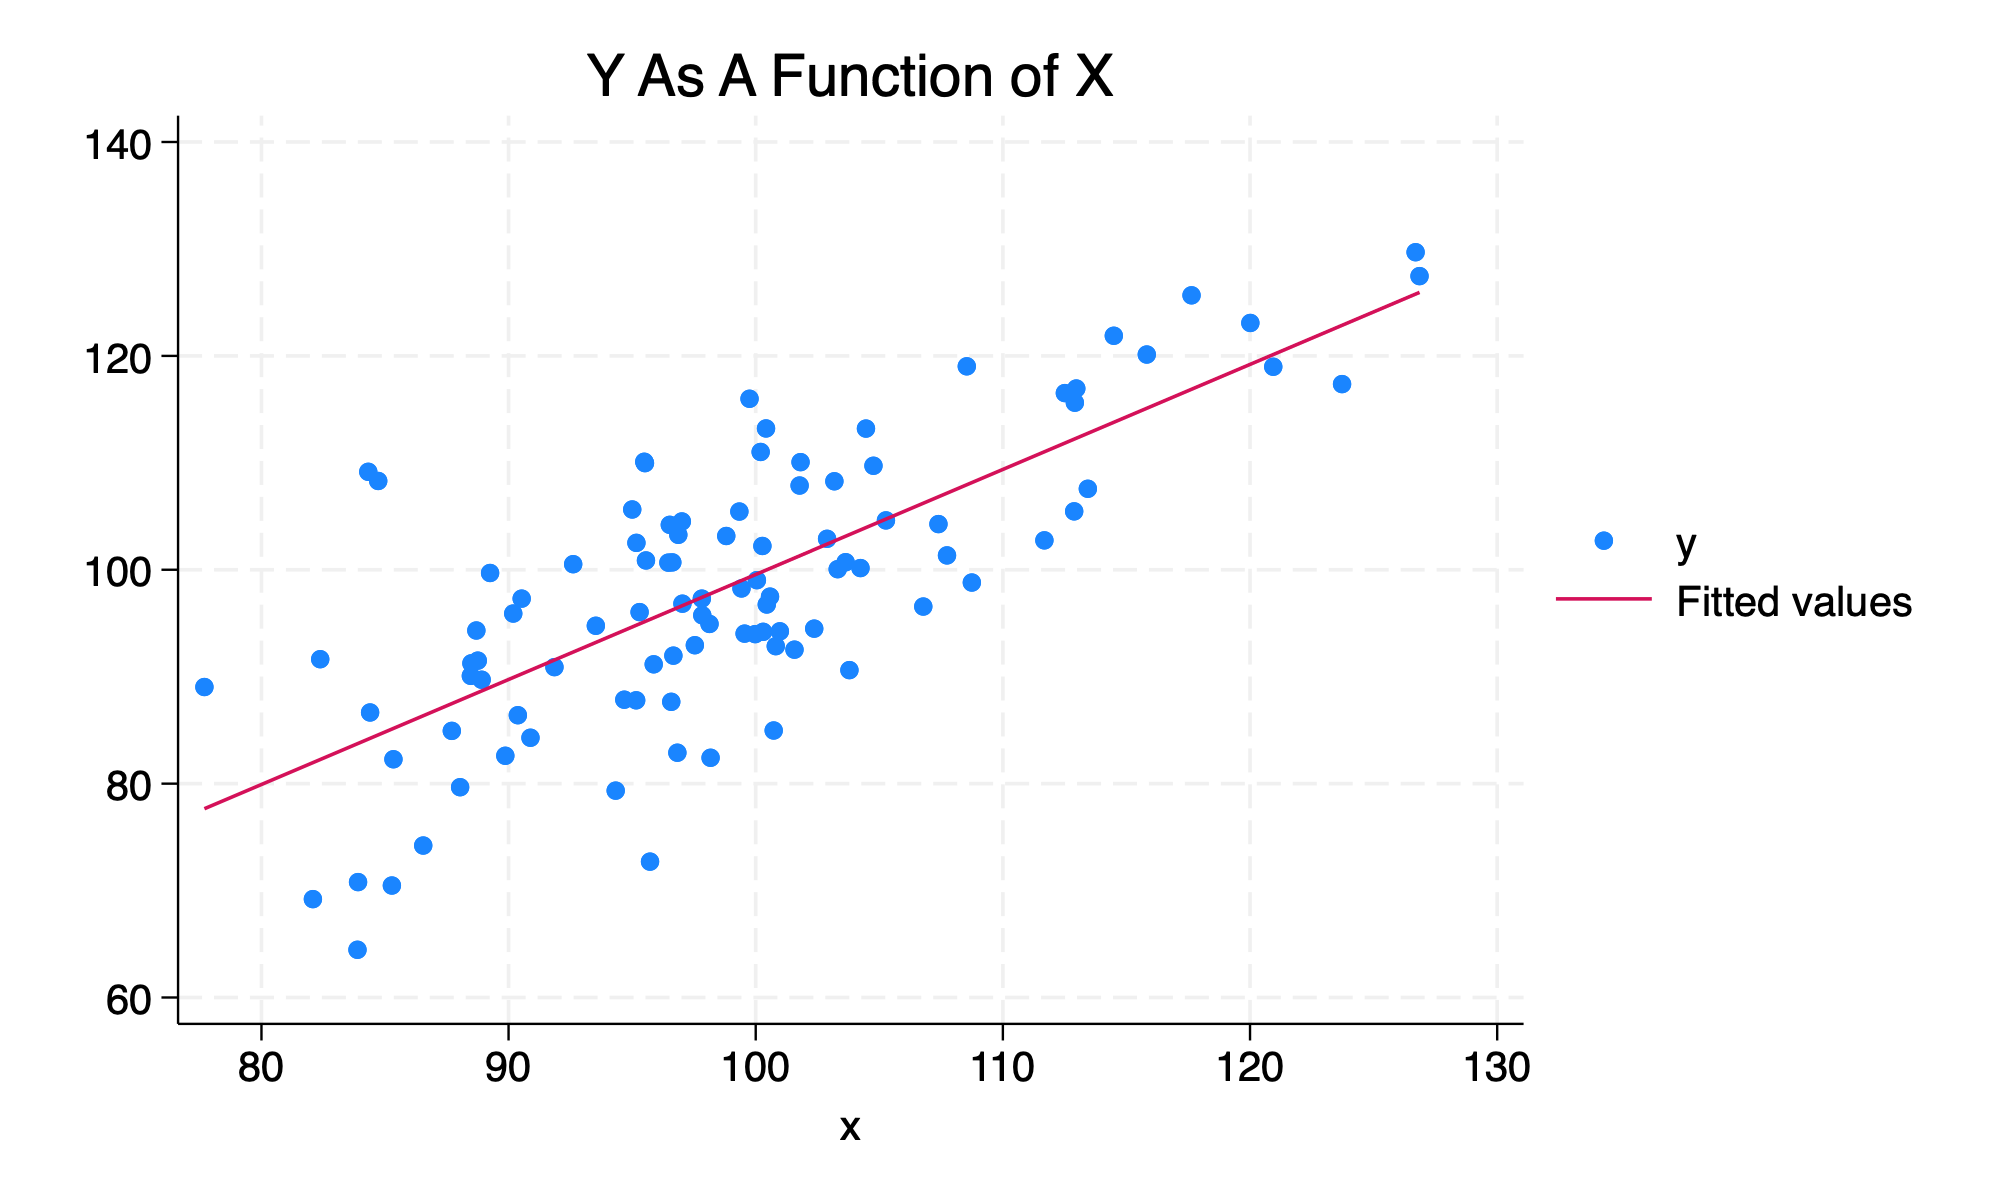
histogram ytwoway scatter y x1spagplot y x1, id(groupid)