4 Conceptual Framework
“Ubuntu” defined as: “A person is a person through other people.” e.g. in (Mangharam, 2017)
“The language we have in that world is not large enough for the territory that we’ve already entered.” (Whyte & Tippett, 2016)
4.1 Units of Analysis and Processes at Multiple Levels
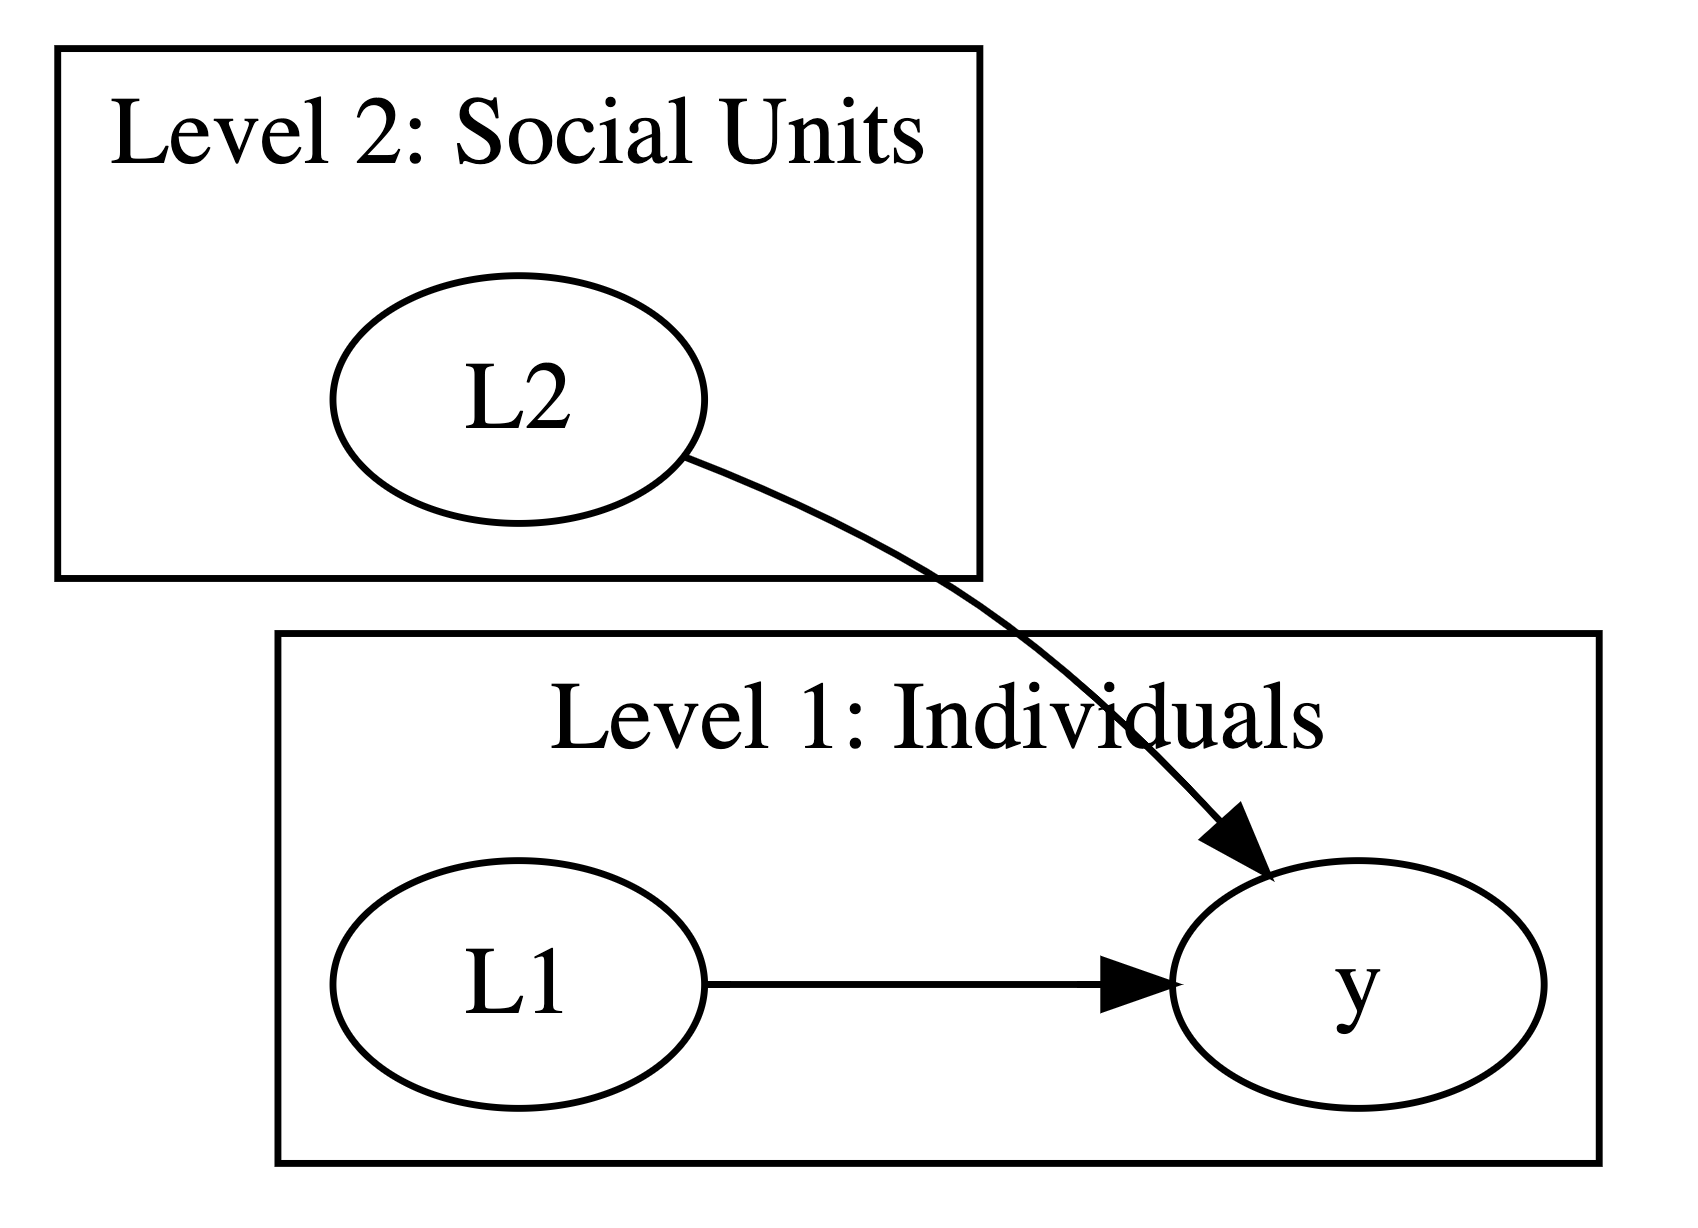
When confronted with multilevel data, one has a number of choices about the units of analysis: one could consider individuals to be the units of analysis; or, one could consider the larger social units to be the units of analyses. With multilevel analytic methods, one is able to avoid this false dichotomy, and to conceptualize the data from a multilevel perspective, wherein both individuals and social units are different levels of the same analysis. I discuss some of the statistical implications of different ideas about the units of analysis in Section 5.8.
Further, with multilevel models, we are not only able to consider the idea of units of analysis at multiple levels of the data, but to consider how variables at both Level 2 and Level 1 may affect an individual level (Level 1) outcome.
4.2 Variables at Multiple Levels
In this book, I distinguish between conceptual and statistical levels of variables.
By conceptual level, I refer to whether a variable is conceptualized to be measure of an individual level characteristic, such as parenting or mental health, or a community level construct, such as community collective efficacy, or community safety.
By statistical level, I refer to whether a variable measures an individual response, or an aggregated response.
| statistical level 1 | statistical level 2 | |
|---|---|---|
| conceptual level 1 | Individual response about parenting or mental health | Aggregated responses about parenting or mental health |
| conceptual level 2 | Individual response about community | Aggregated response about community |
| conceptual level 2 | N/A | Administrative indicator of social unit |
Thus, \(\text{mental health}_{ij}\) or \(\text{parenting}_{ij}\) would be considered in the terminology that I am using to be a variable both conceptually and statistically at Level 1.
\(\overline{\text{mental health}_{.j}}\) or \(\overline{\text{parenting}_{.j}}\) would be variables that conceptually come from Level 1 responses, but are statistically aggregated to Level 2.
Such aggregated variables represent the average level of a response across each Level 2 unit, and are sometimes called “contextual variables” (Diez Roux, 2002). These aggreagated variables could be included in the model alongside the individual level, or Level 1, predictors. Discussion of ways to create variables that are the average of a predictor is contained in the Appendix.
Using my terminology, \(\text{community collective efficacy}_{ij}\) or \(\text{community safety}_{ij}\) would be considered to be a variable that was conceptually at Level 2, but statistically at Level 1.
\(\overline{\text{community collective efficacy}_{.j}}\) or \(\overline{\text{community safety}_{.j}}\) would be variables that conceptually refer to Level 2 concepts that are statistically aggregated to Level 2.
Some variables only exist at Level 2, and their Level 1 counterparts are undefined. For example, the size of a school, neighborhood, or country, is inherently a Level 2 variable, with no easily definable Level 1 counterpart. Similarly, some administrative indicators, such as the Gini level of inequality, while developed by calculating across Level 1 responses, have no easily definable Level 1 counterpart.
4.3 Multilevel Models As The Exploration Of Variation and Diversity
Multilevel models are sometimes seen as an analytic technique that controls for the clustering or nesting of individuals inside larger social units such as schools, neighborhoods, or countries. I will describe below how this ability to control for clustering is indeed an important and crucial aspect of multilevel models.
However, my argument here is that multilevel models are better seen as a method to explore the variation and diversity inherent within nested or clustered data. Again, while these issues are well understood within the statistical literature (Kreft & de Leeuw, 1998; Luke, 2004; Rabe-Hesketh & Skrondal, 2012; Raudenbush & Bryk, 2002; Singer & Willett, 2003), they are less often noted in applied research.
4.3.1 A First Example: A Study Of Parenting And Child Development
In the graph below, imagine that physical punishment, or some other risk factor, is associated with detrimental mental health outcomes. Each country in the data has its own country specific regression line.
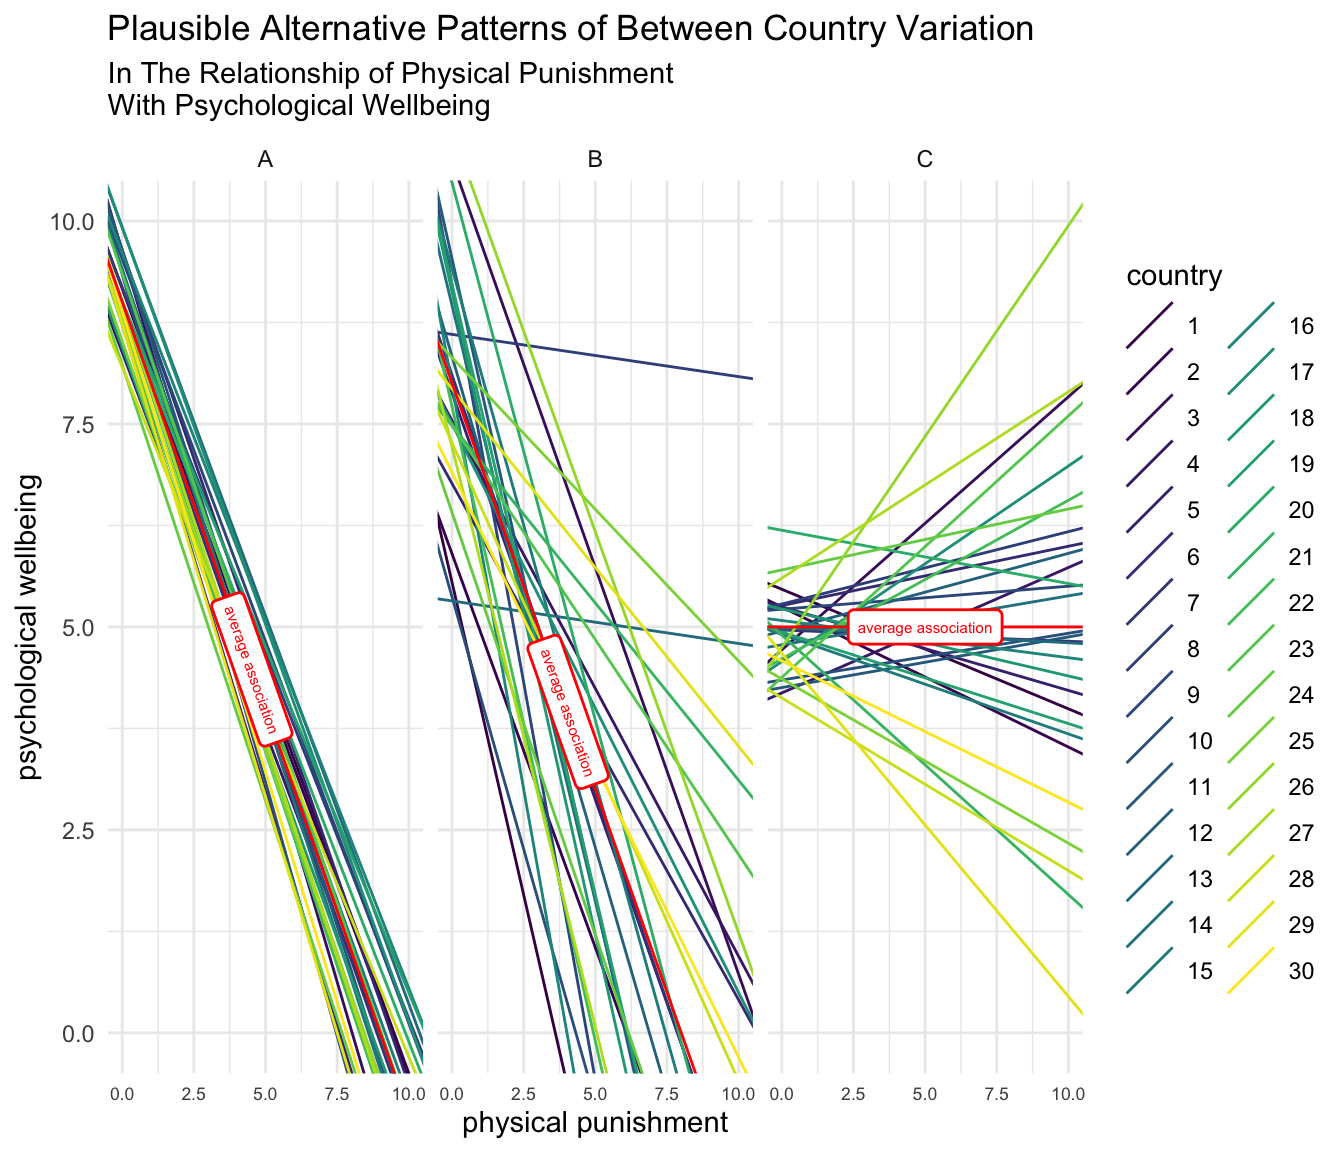
In Panel A, there is some variation in the intercept, which is equivalent to saying that there is some variation in the average level of psychological well-being across countries. When we look at the slope of the country-specific regression lines in Panel A, we notice that there is little variation in these slopes. Put another way, there is a great amount of consistency in the slopes of the country-specific regression lines: parental use of physical punishment is consistently associated with decreases in child psychological wellbeing across countries.
In Panel B, the situation is different. There is more variation in the intercept, that is, more variation between countries in the initial or average amount of psychological well-being. There is also more variation in the slopes of the country-specific regression lines. While the average association between physical punishment and psychological well-being is very similar to that in Panel A, there is more variation across countries, in the relationship of physical punishment and child psychological wellbeing, which would likely merit exploration were one considering developing programs, policies or interventions for different countries.
Lastly, the pattern of variation in Panel C is considerably different from either Panel A or Panel B. The average association of physical punishment with psychological well-being in the hypothetical scenario represented by Panel C is approximately 0. There is some variation in the intercepts of the country-specific regression lines. Additionally, there is considerable variation in the slopes of the country-specific regression line, suggesting that the use of physical punishment might be beneficial in some countries, and detrimental in others.
Empirically, data generally suggest a scenario somewhere between Panel A and Panel B, but these different hypothetical scenarios afford us the opportunity to think about possible patterns of variation.
4.3.2 A Second Example: A Study Of A Treatment Or Intervention
A second pedagogically helpful example might be obtained if we flip the slopes in the diagram, and consider a different set of independent variables, perhaps some kind of treatment or intervention designed to improve psychological well-being.
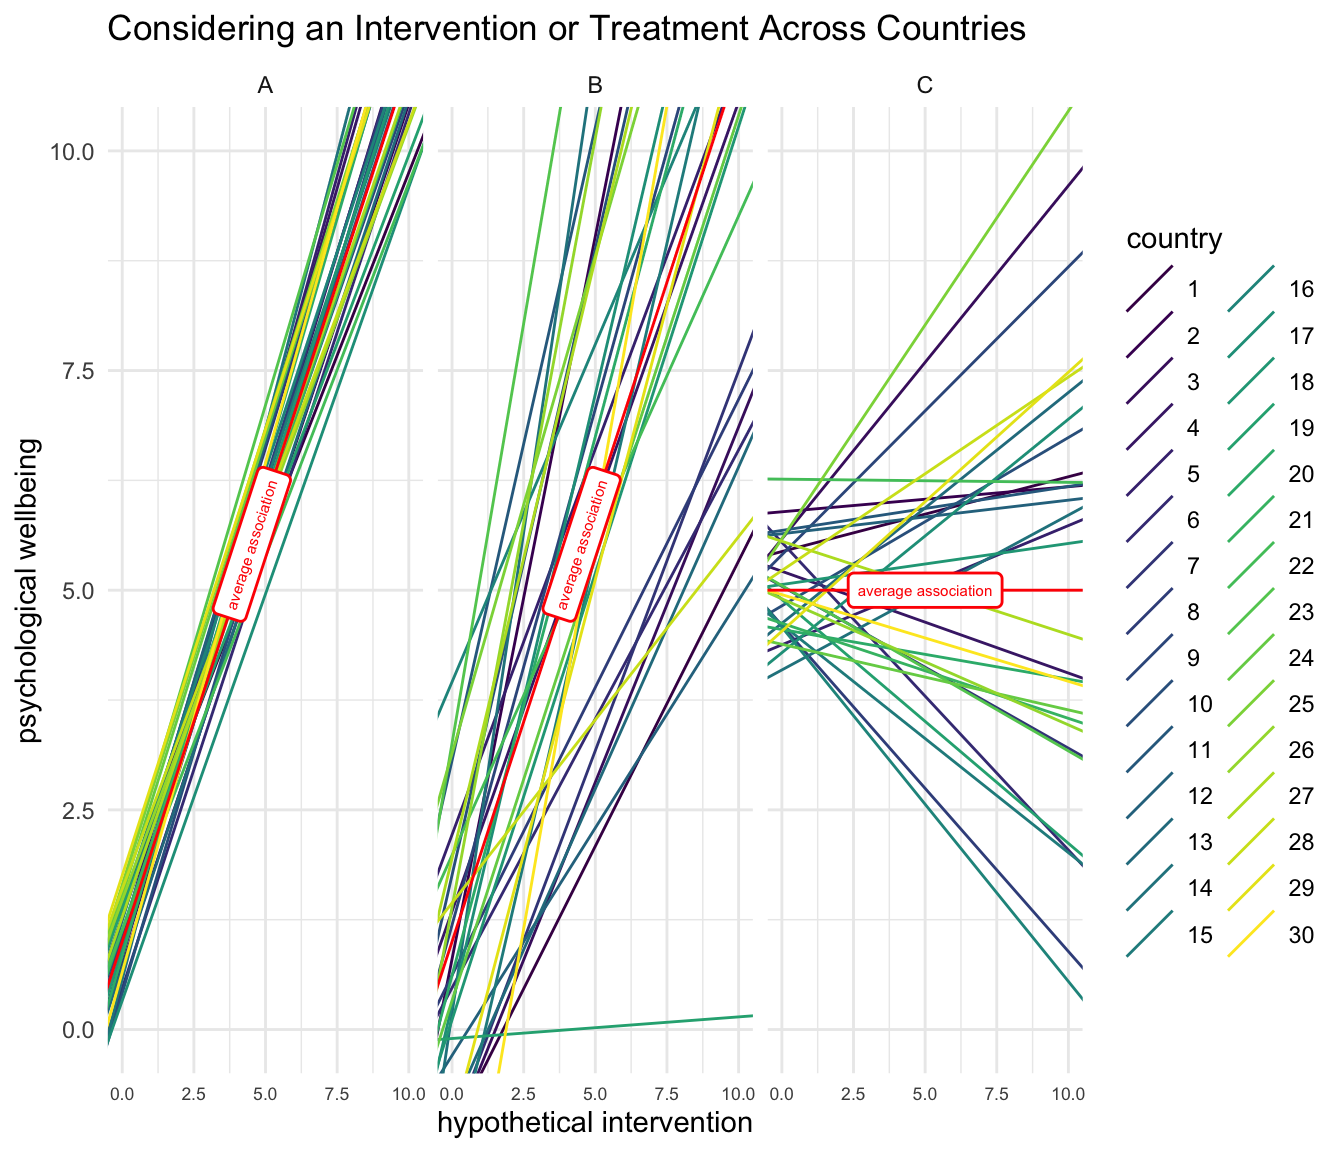
We see a similar pattern as before, but the use of a different substantive example may be illustrative.
In Panel A, there is relative consistency in the initial levels of psychological well-being across countries, as well as consistency in the degree to which the intervention is associated with improvements in psychological well-being across countries.
In Panel B, we see more variation in both initial levels of psychological well-being, but also more variation in the association of the intervention with improvements in psychological well-being.
Lastly, in Panel C, we note an overall association of the intervention with psychological well-being that is close to zero. However associations vary widely by countries. In some countries there appears to be evidence that the intervention is beneficial, while in other countries there appears to be evidence that the intervention is not beneficial, or even possibly harmful.
4.3.3 Exploring Variation
Thus, I emphasize an approach to multilevel modeling that sees multilevel modeling as the study of variation, not simply accounting for variation, or controlling for variation.
“… universal theorizing requires adequately sampled (i.e., diverse) data and better appreciation of issues of comparability and the most powerful theories ought to predict and explain variation, not sweep variation under the rug.” (Blasi et al., 2022)
As I discuss these ideas in more statistical depth, later in the book, I develop more statistically based ideas about the study of diversity and variation in Section 5.4.2, Section 5.6, and Section 5.9.
Again, statistically sophisticated treatments of all of the ideas are available in one form or another across the excellent textbooks on multilevel modeling (Kreft & de Leeuw, 1998; Luke, 2004; Rabe-Hesketh & Skrondal, 2012; Raudenbush & Bryk, 2002; Singer & Willett, 2003). However, some of these ideas appear less often in applied research, and my intention here is to make the application of these ideas to applied research, and to concerns of variation and diversity, more clear.