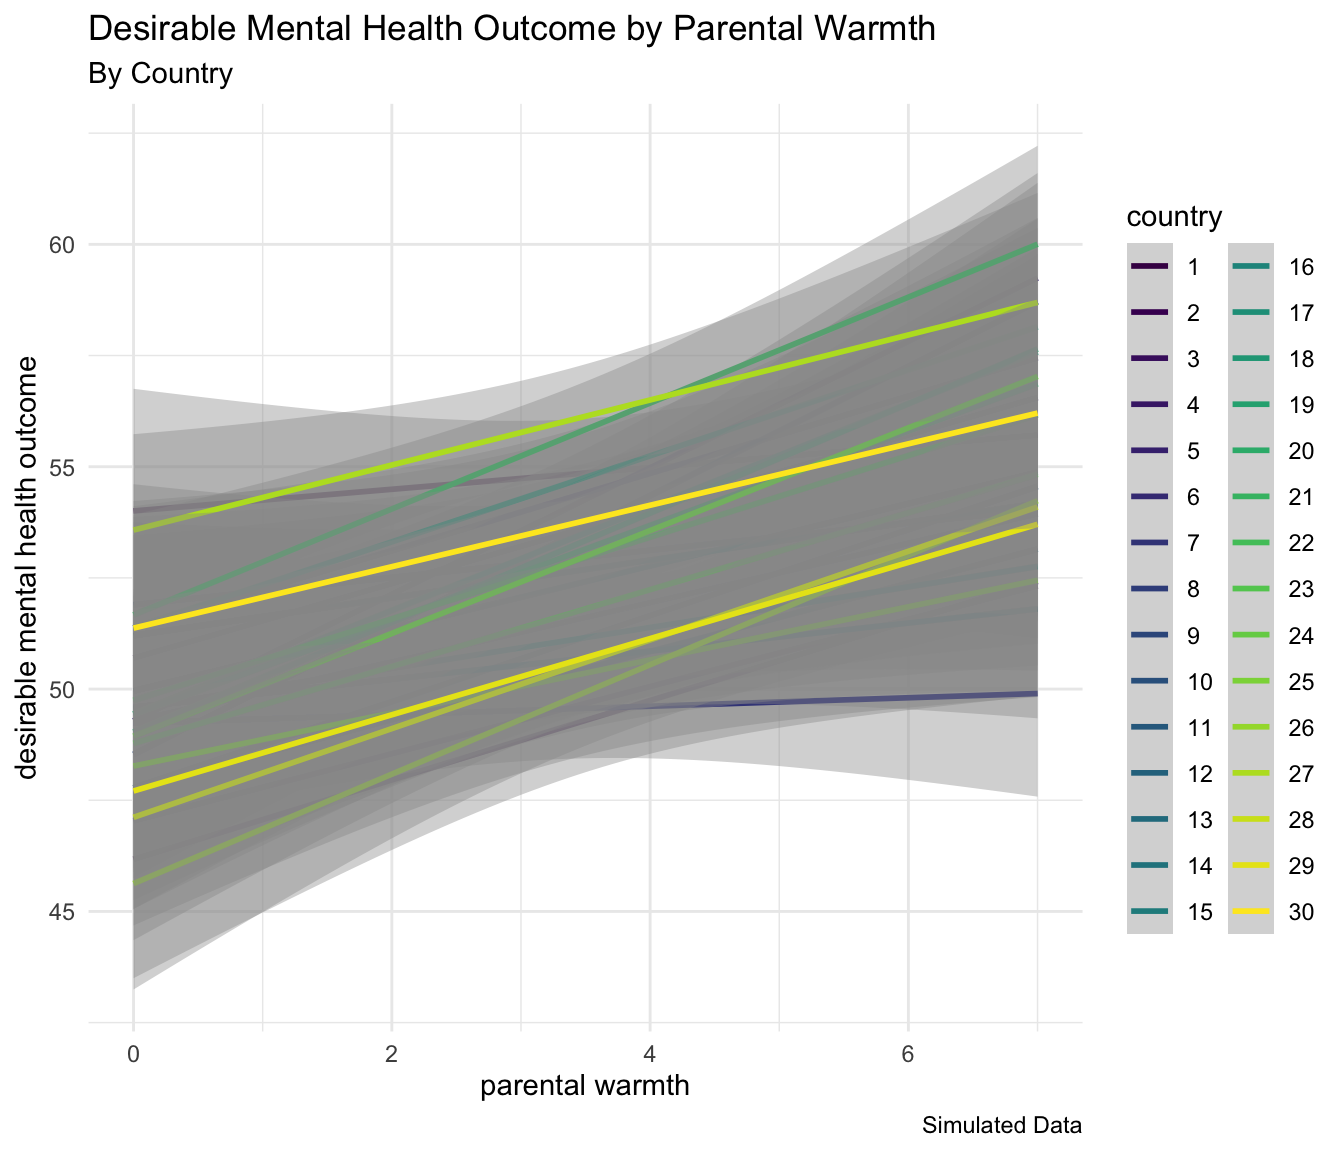
3 Simulated Multi-Country (Multilevel) Data
“… the particular and the universal are not to be seen as opposites, … the universal is not the negation of the particular but is reached by a deeper exploration of the particular.” (Cesaire in UNESCO (1997))
I use simulated data in this example. Data come from 30 hypothetical countries. Data contain measures of a few key aspects of parenting1 or caregiving that have proven salient in the empirical literature on parenting to date: parental warmth, and physical punishment. Both parenting measures are normally distributed variables, and are considered to be Level 1, or individual level variables.
identity is a hypothetical designation of an identity, such as a race, ethnicity, or gender identity. In this simulated data, identity has two categories–for ease of presentation–but could easily be a more than two category variable. identity is also a Level 1 variable.
Many readers will be interested in using multilevel models to evaluate interventions. The variable intervention represents a program, treatment or intervention to which study participants have been assigned. intervention is a Level 1 variable. Assignment to interventions may or may not be random, a topic which is considered in more detail in Section 6.7.
HDI is a measure of the Human Development Index (United Nations Development Program, 2022), and is measured at the country level, or Level 2. (I discuss more in depth thinking about levels of the data in Chapter 4.)
Our outcome is conceptualized as a positive mental health outcome or behavioral outcome, and higher levels of outcome are considered to be better. Statistically, the data are clustered within countries.
Download The Data
Data are presented in Stata format. The Appendix considers the analysis of multilevel models using multiple software packages: Stata, R & Julia, but Stata format is used to store the data as it can be read by each of these software packages.
In this simulation, I construct the data so that warmth is positively related to the outcome, while physical punishment is negatively related to the outcome.
| id | country | warmth | physical_punishment | identity | intervention | HDI |
|---|---|---|---|---|---|---|
| 1.1 | 1 | 3 | 3 | 2 | 1 | 69 |
| 1.2 | 1 | 1 | 2 | 2 | 2 | 69 |
| 1.3 | 1 | 2 | 3 | 1 | 2 | 69 |
| 1.4 | 1 | 5 | 0 | 2 | 1 | 69 |
| 1.5 | 1 | 4 | 4 | 2 | 1 | 69 |
| 1.6 | 1 | 3 | 5 | 1 | 2 | 69 |
| outcome |
|---|
| 58.47 |
| 51.1 |
| 53.92 |
| 61.17 |
| 56.05 |
| 50.81 |
I use the term parenting throughout this book, but am aware that such parenting may come from biological parents, or from other caregivers.↩︎