2 Estimation of p Values
2.1 Grouped and Individual Data
Bland and Altman (1994) suggested the following procedure for simulating some data:
“The data were generated from random numbers, and there is no relation between X and Y at all. Firstly, values of X and Y were generated for each ‘subject,’ then a further random number was added to make the individual observation.” (Bland and Altman 1994)
So… we follow their procedure.
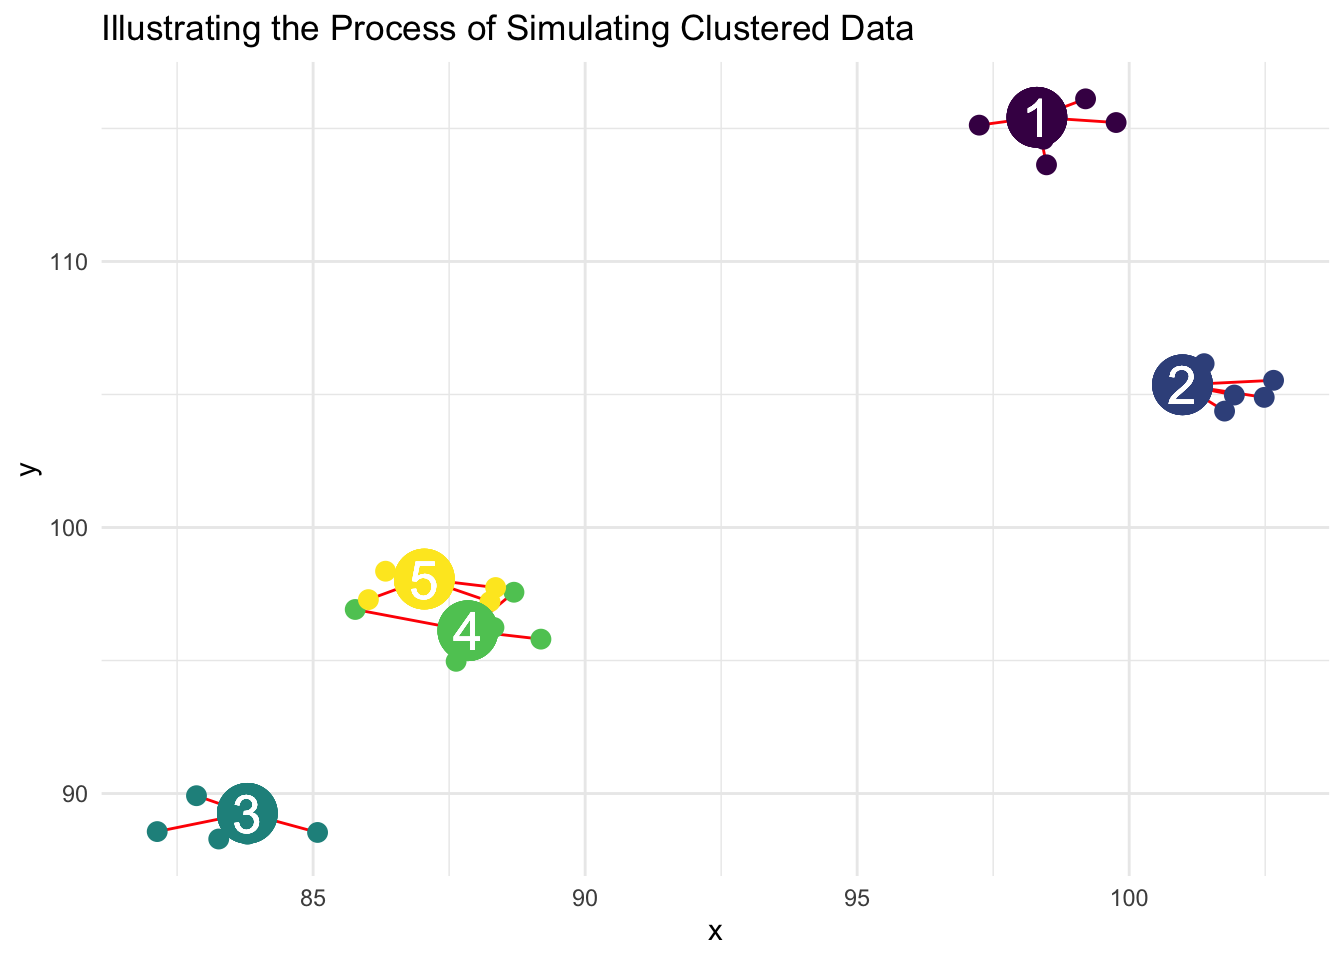
NoteSimulating The Data
The graph below illustrates the process of simulating the data.
2.2 Analyses
2.2.1 OLS
An OLS analysis indicates that there is a statistically significant association of \(x\) and \(y\).
                         OLS1
-------------------------------
x_individual           1.046 **
Intercept              4.488
Number of observations    25
-------------------------------
** p<.01, * p<.05
2.2.2 MLM
In contrast, an MLM analysis (correctly) finds that there is no statistically significant association of \(x\) and \(y\).
                          MLM1
--------------------------------
x_individual            0.039
Intercept              97.005 **
var(_cons)             74.523
var(e)                  0.594
Number of observations     25
--------------------------------
** p<.01, * p<.05
2.2.3 Compare OLS and MLM
                         OLS1      MLM1
-----------------------------------------
x_individual           1.046 **  0.039
Intercept              4.488    97.005 **
var(_cons)                      74.523
var(e)                           0.594
Number of observations    25        25
-----------------------------------------
** p<.01, * p<.05