Show the code
barplot(rep(1,10), col = heat.colors(10), axes = FALSE)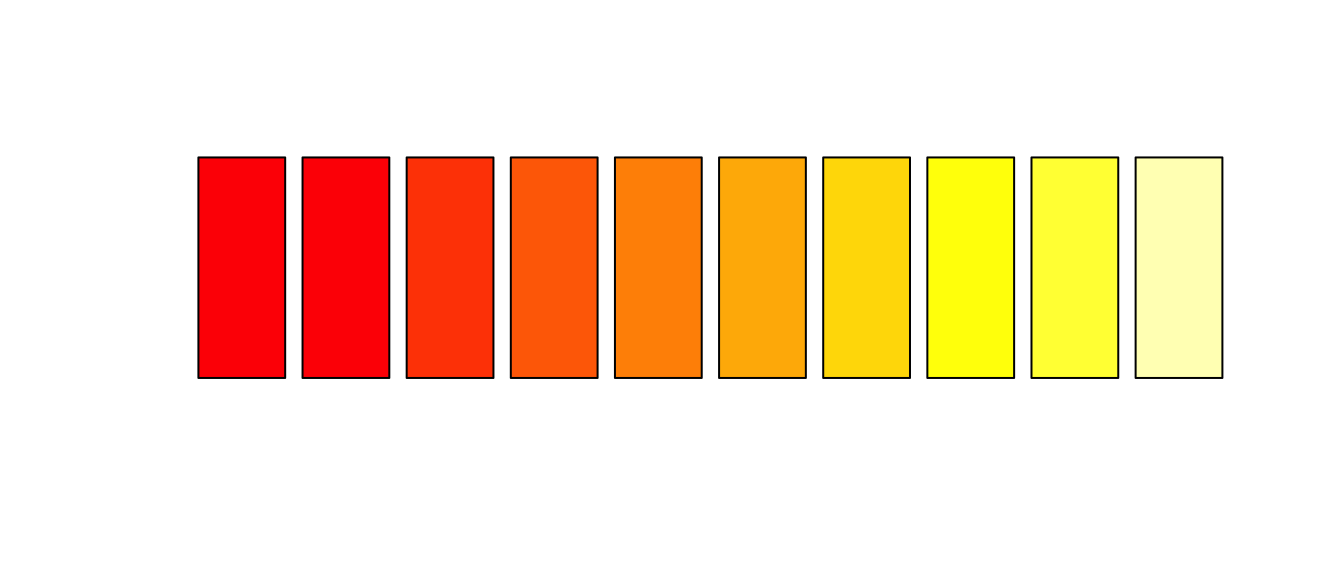
Shapefiles (Chapter 8) are a standard format for storing geographic data.
Shapefiles generally come in three types: points ●; lines ━; and polygons ▭▯.
Symbology is the idea of using shapefile attributes to encode quantitative (continuous) or qualitative (discrete; categorical) information, such as income or program participation.
| Shapefile Type | Symbology |
|---|---|
| Points | Size: ● ● ● |
| Discrete Color: ● ● ● | |
| Continuous Color: ● ● ● | |
| Lines | Width: ━ ━ ━ |
| Discrete Color: ━ ━ ━ | |
| Continuous Color: ━ ━ ━ | |
| Pattern: ━ ┅ | |
| Polygons | Discrete Color: ■ ■ ■ |
| Continuous Color: ■ ■ ■ | |
| Pattern: ■ ▤ ▦ |
Color palettes can be either qualitative (discrete; categorical) or quantitative (continuous) in nature.
The code used to generate these color palettes is shown for reference, but may not be the exact code needed when these colors are used in maps.
barplot(rep(1,10), col = heat.colors(10), axes = FALSE)
barplot(rep(1,10), col = topo.colors(10), axes = FALSE)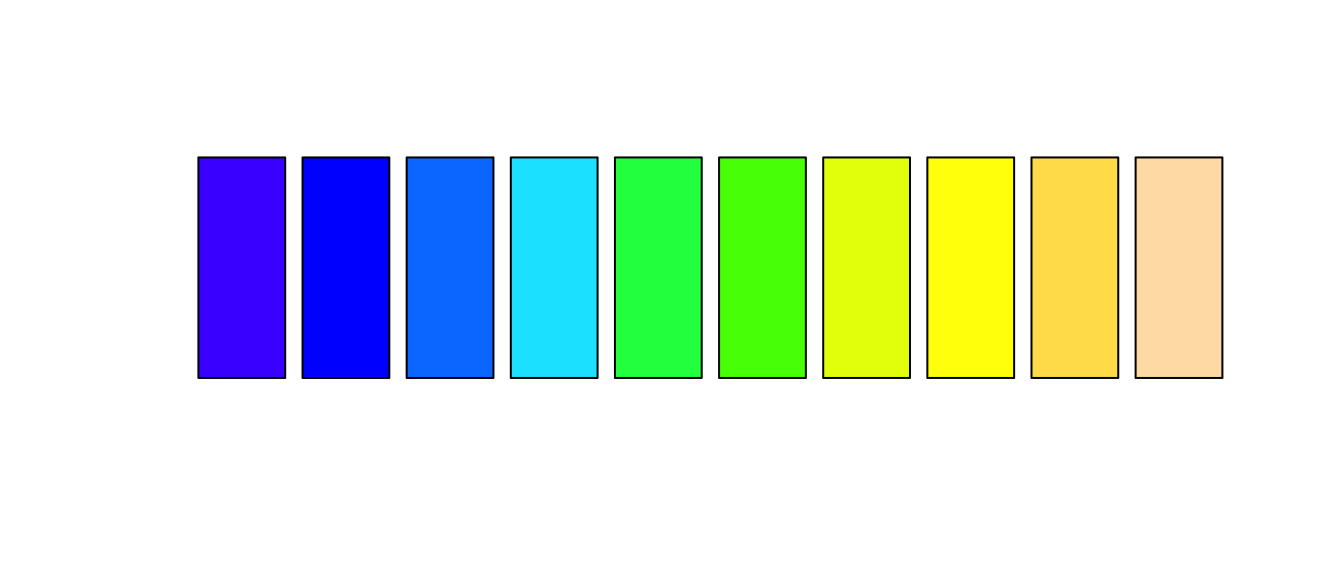
barplot(rep(1,10), col = terrain.colors(10), axes = FALSE)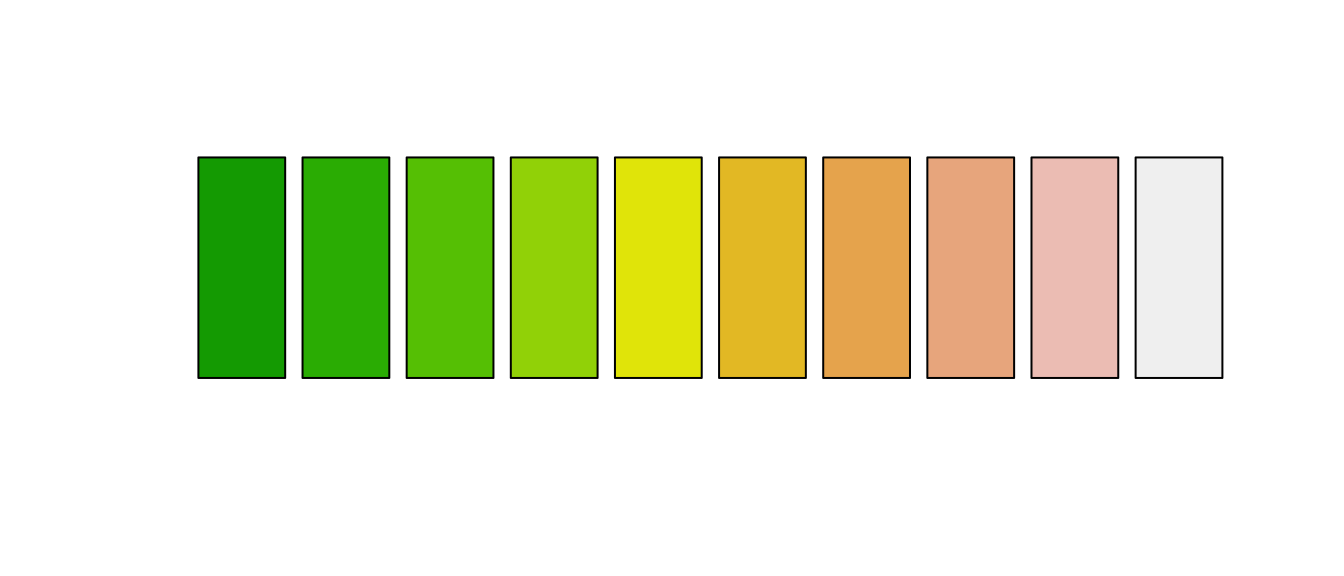
library(RColorBrewer) # A library for color palettesdisplay.brewer.pal(name = "Blues", n = 9)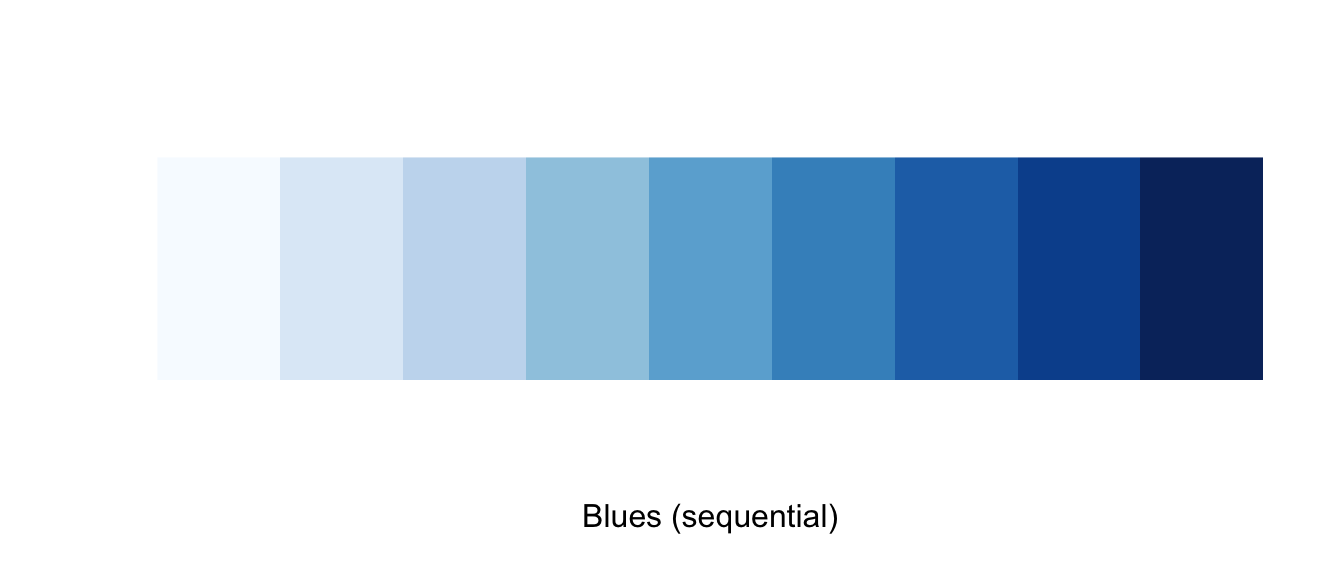
display.brewer.pal(name = "Spectral", n = 9)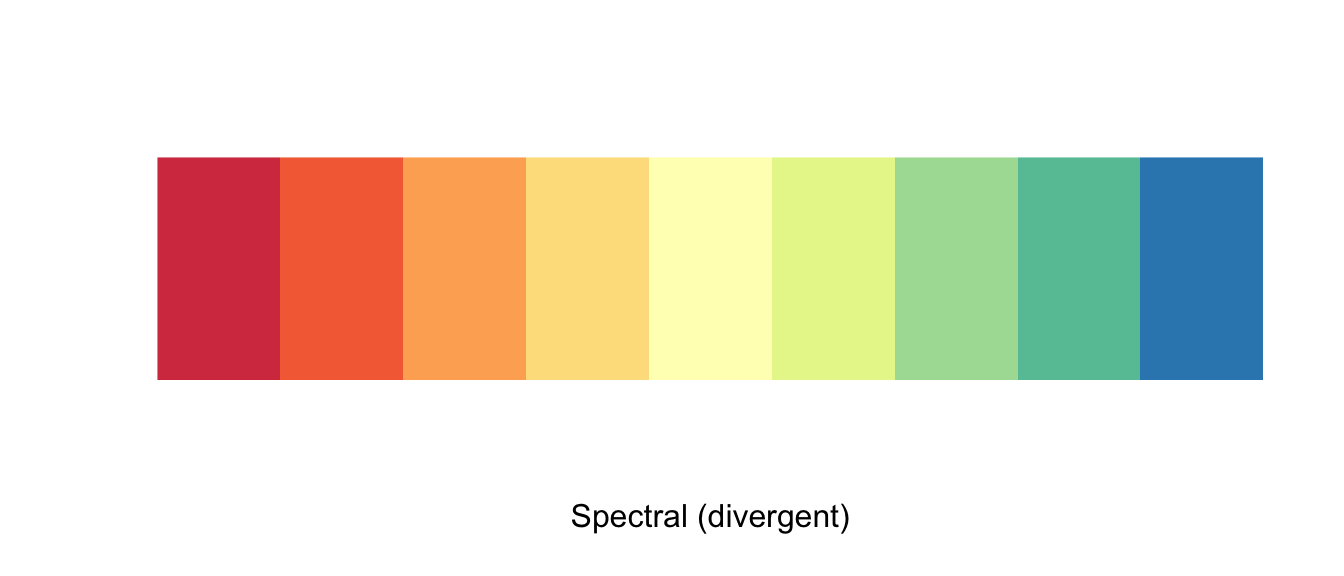
display.brewer.pal(name = "Set1", n = 9)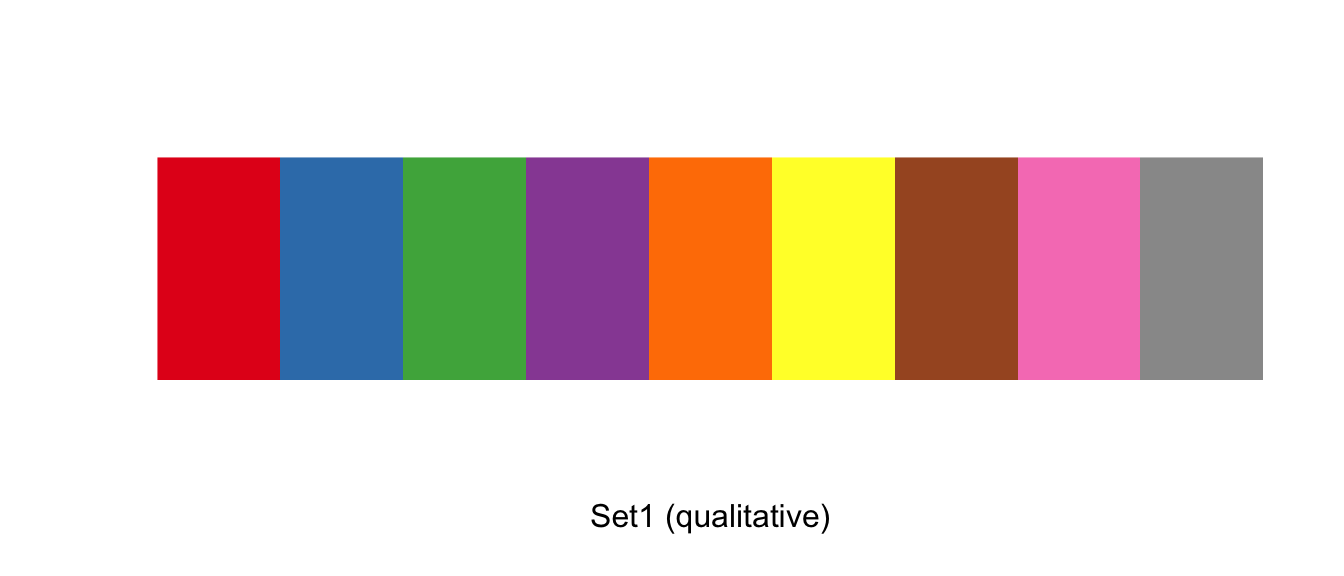
More details can be found at https://cran.r-project.org/web/packages/viridis/vignettes/intro-to-viridis.html
library(scales)show_col(viridis_pal()(9),
ncol = 9, # 9 columns
labels = FALSE) # no labels 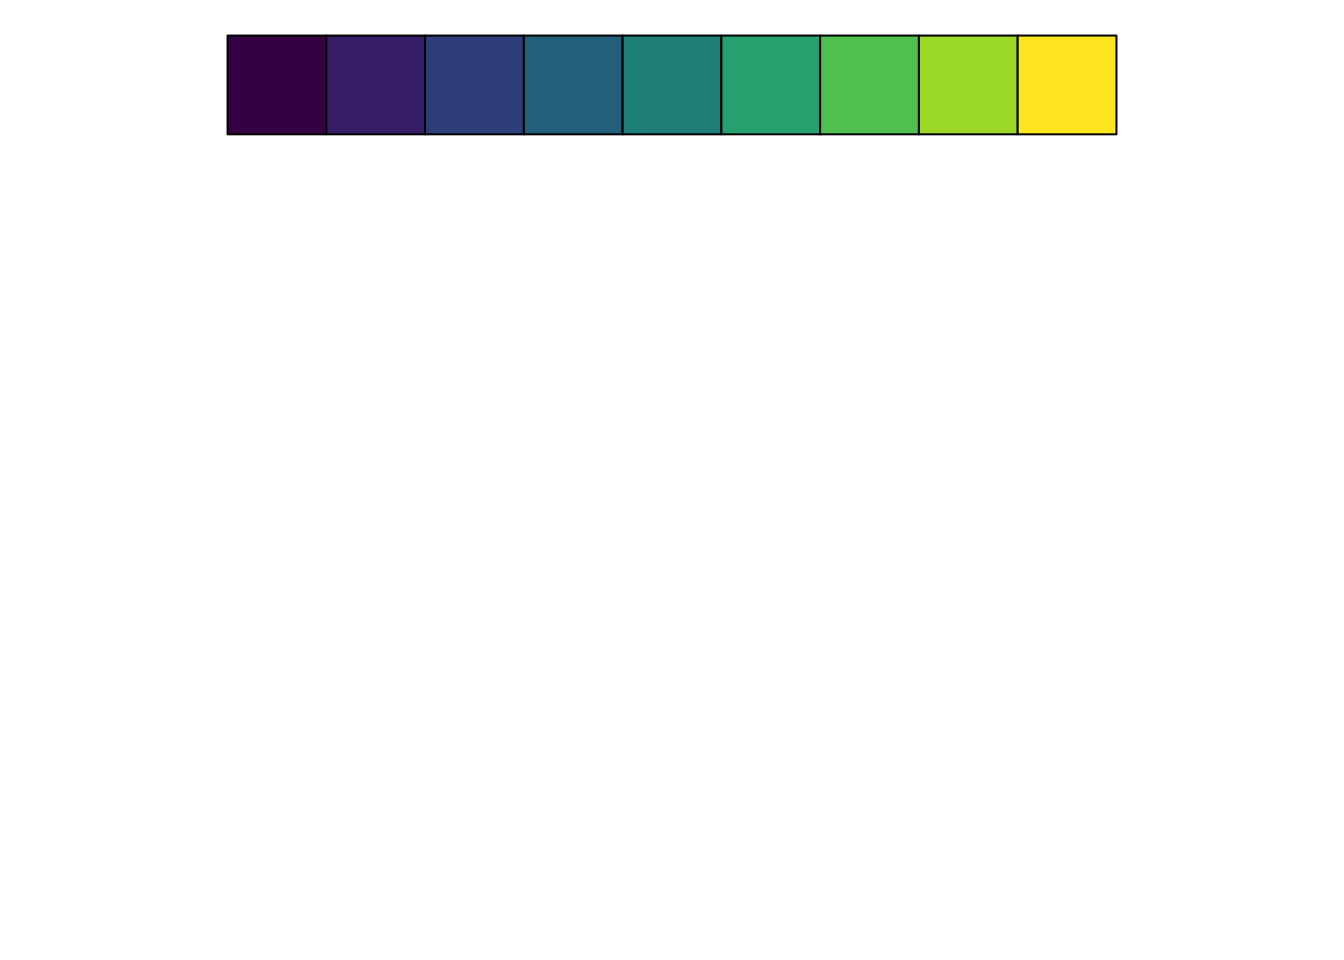
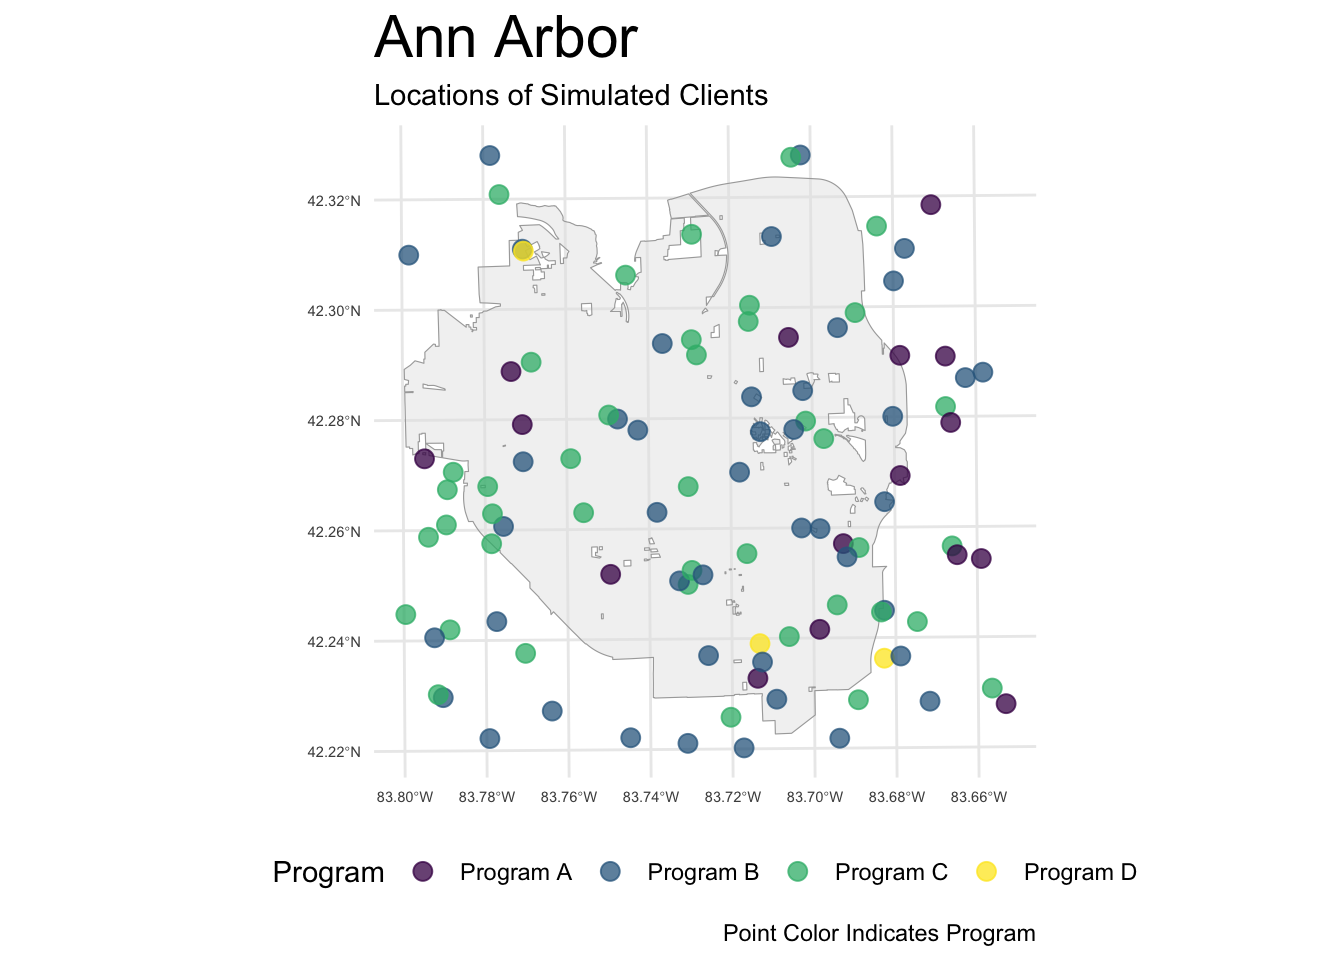
library(ggplot2) # graphing and mapping

library(sf) # simple features

city_boundary <- read_sf("./shapefiles/AA_City_Boundary/AA_City_Boundary.shp")

clients <- read_sf("./shapefiles/clients/clients.shp")

ggplot(city_boundary) +
  geom_sf(color = "darkgrey", alpha = .5) +
  geom_sf(data = clients,
          aes(color = program), # color = program
          size = 3, # size
          alpha = .75) + # transparency
  labs(title = "Ann Arbor",
       subtitle = "Locations of Simulated Clients",
       caption = "Point Color Indicates Program") +
  scale_color_viridis_d(name="Program") + # nice viridis colors
  theme_minimal() +
  theme(plot.title = element_text(size = rel(2)),
        axis.text = element_text(size = rel(.5)),
        legend.position = "bottom")